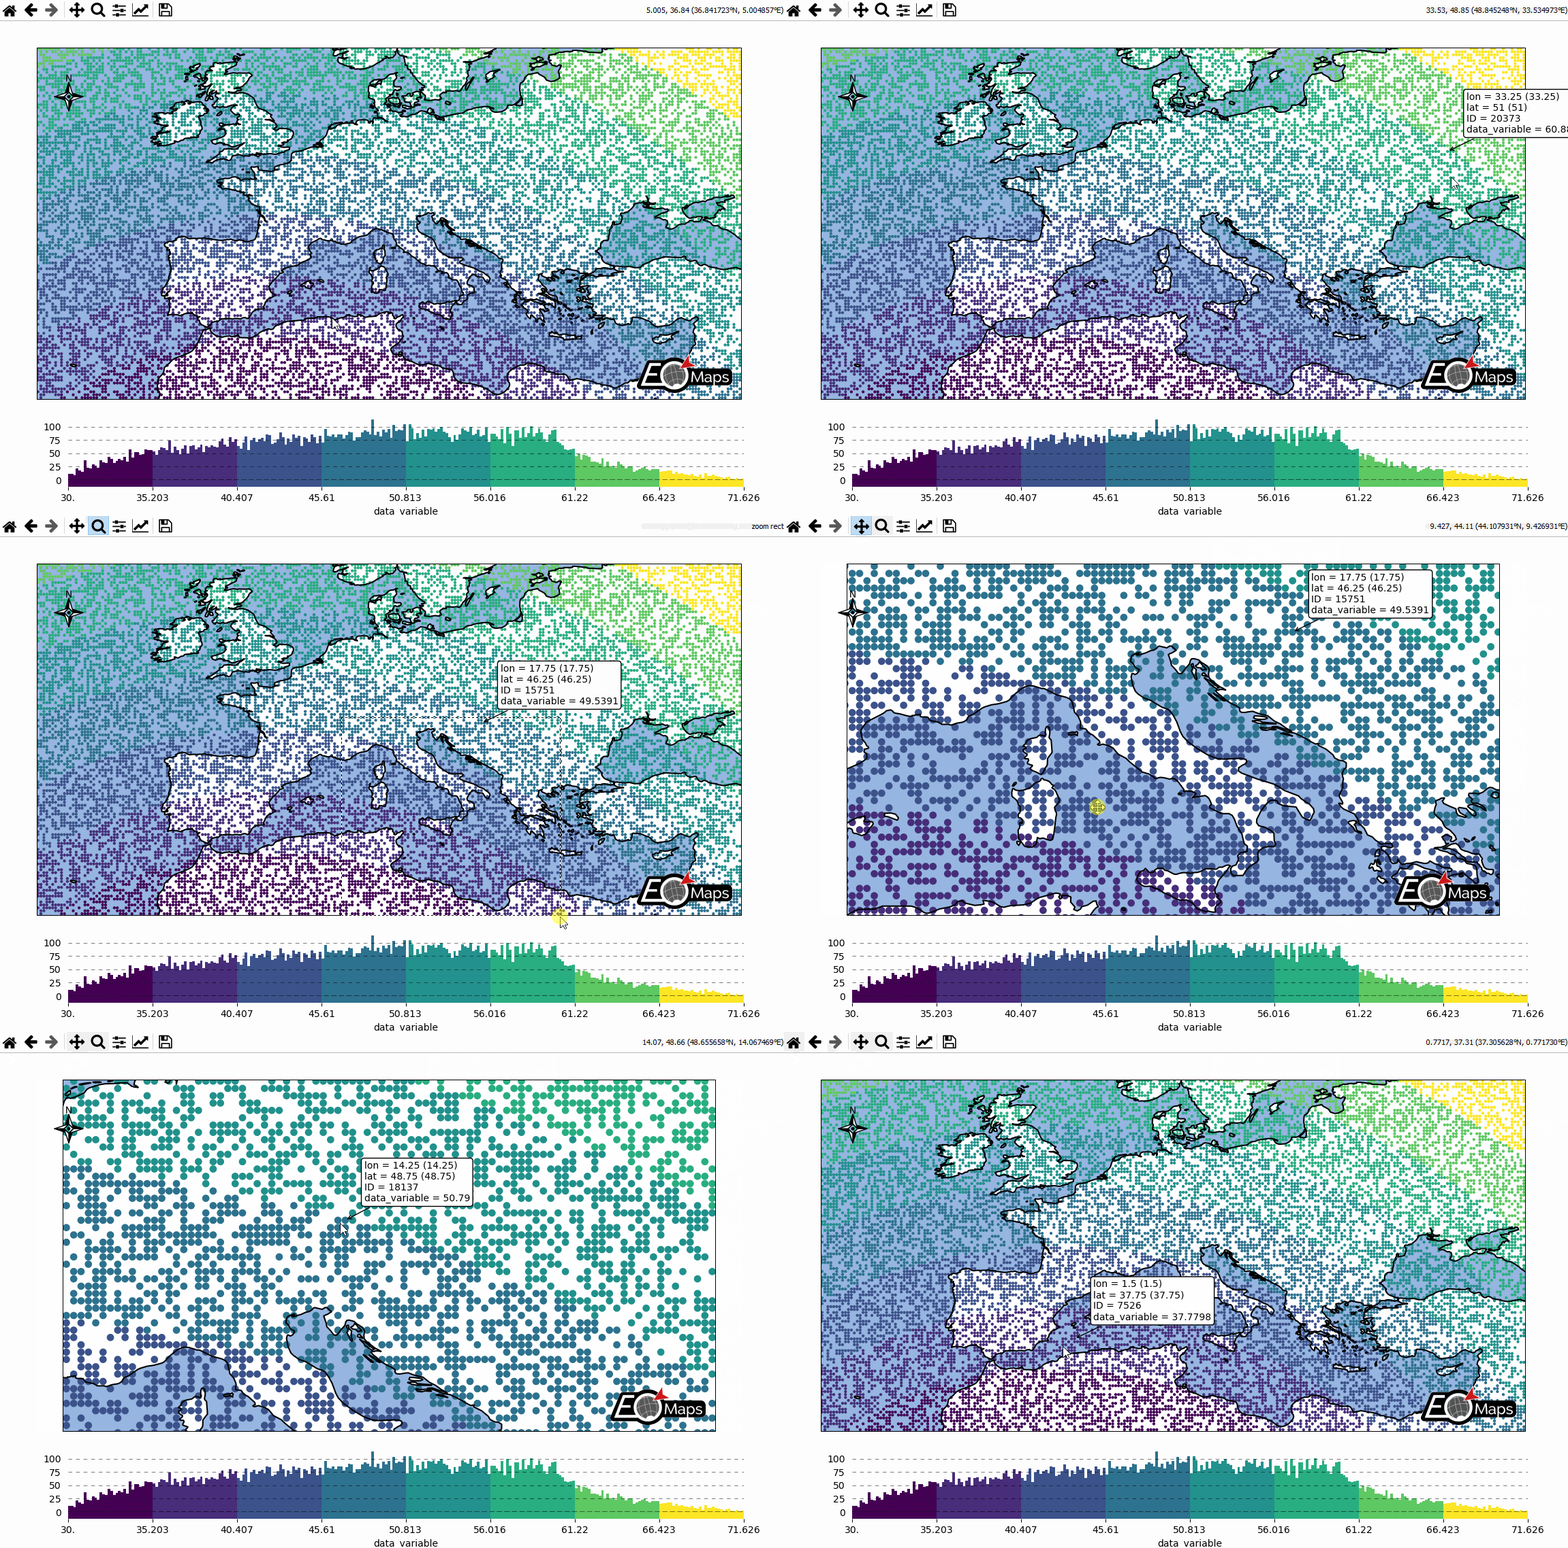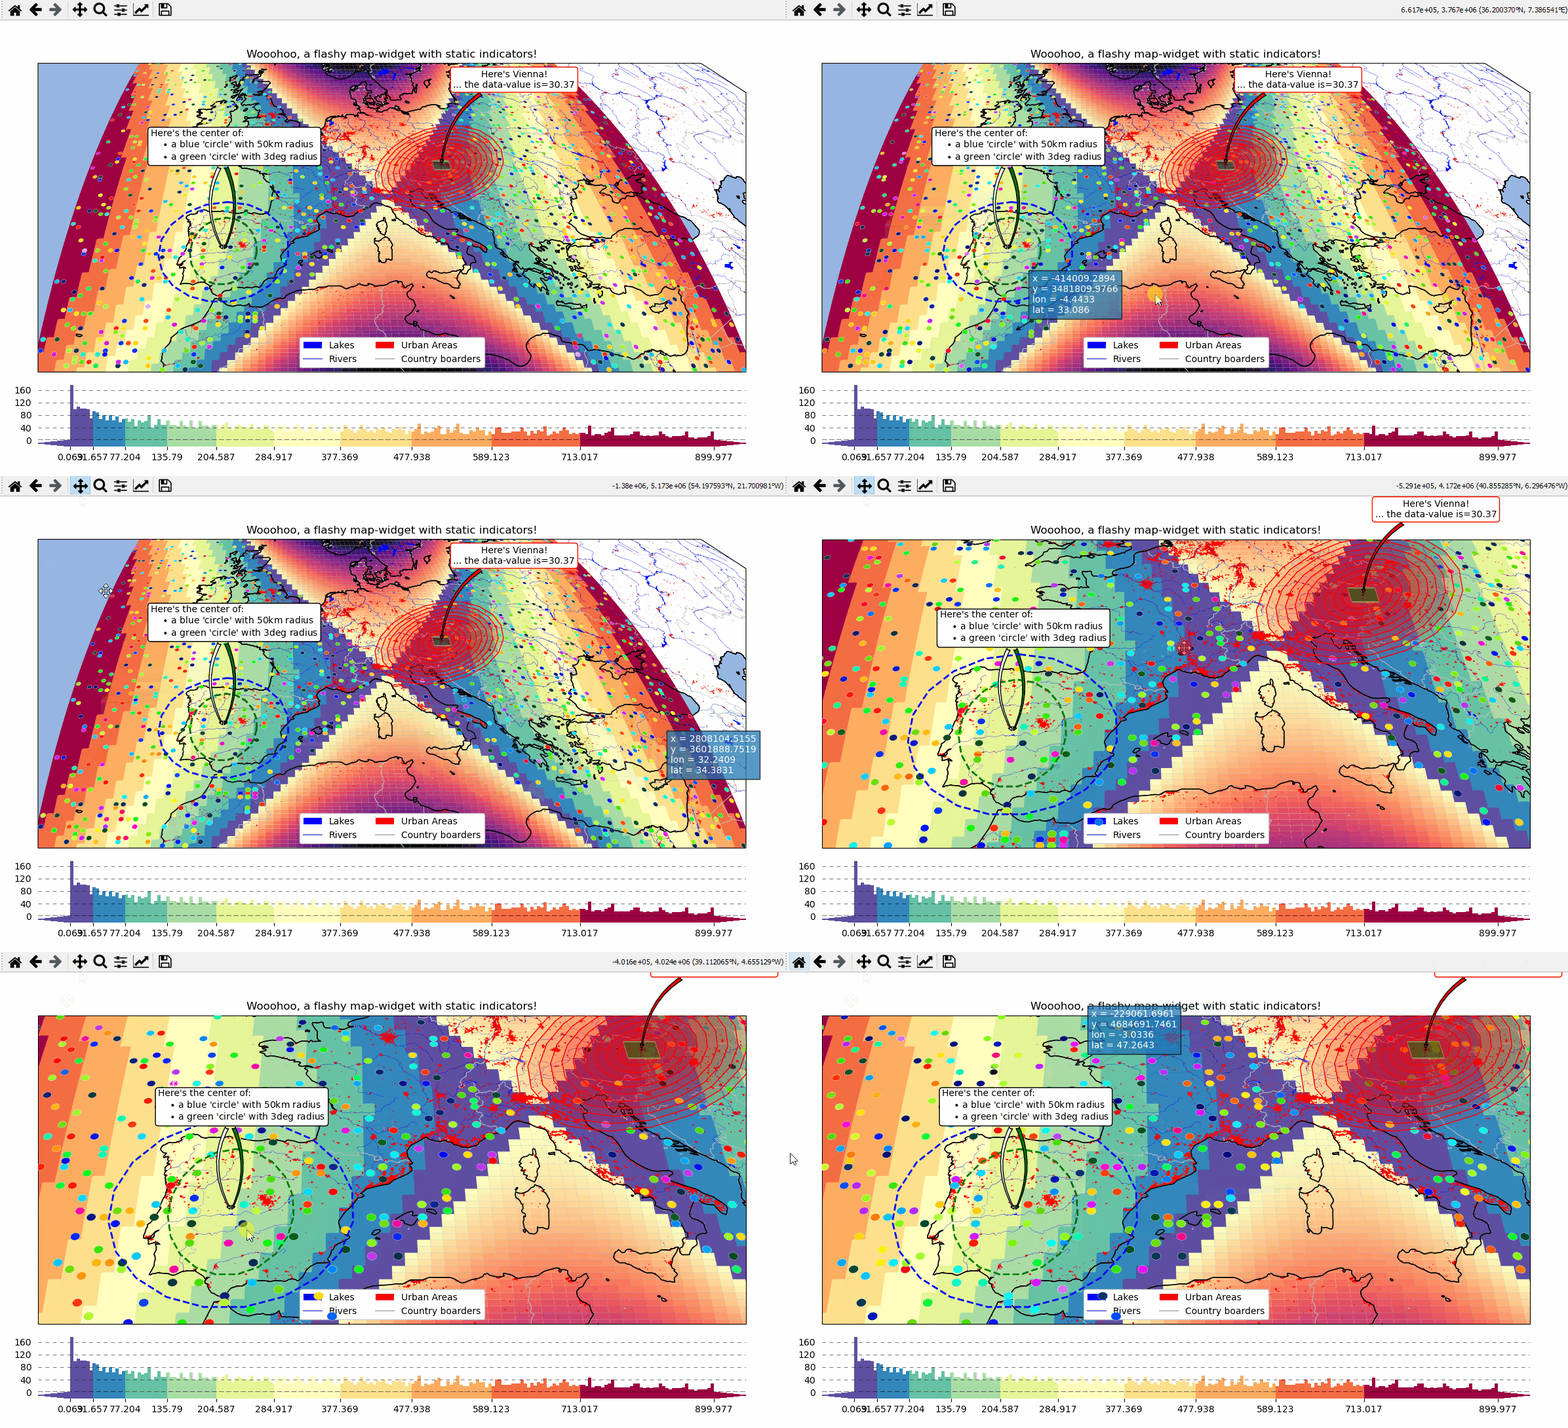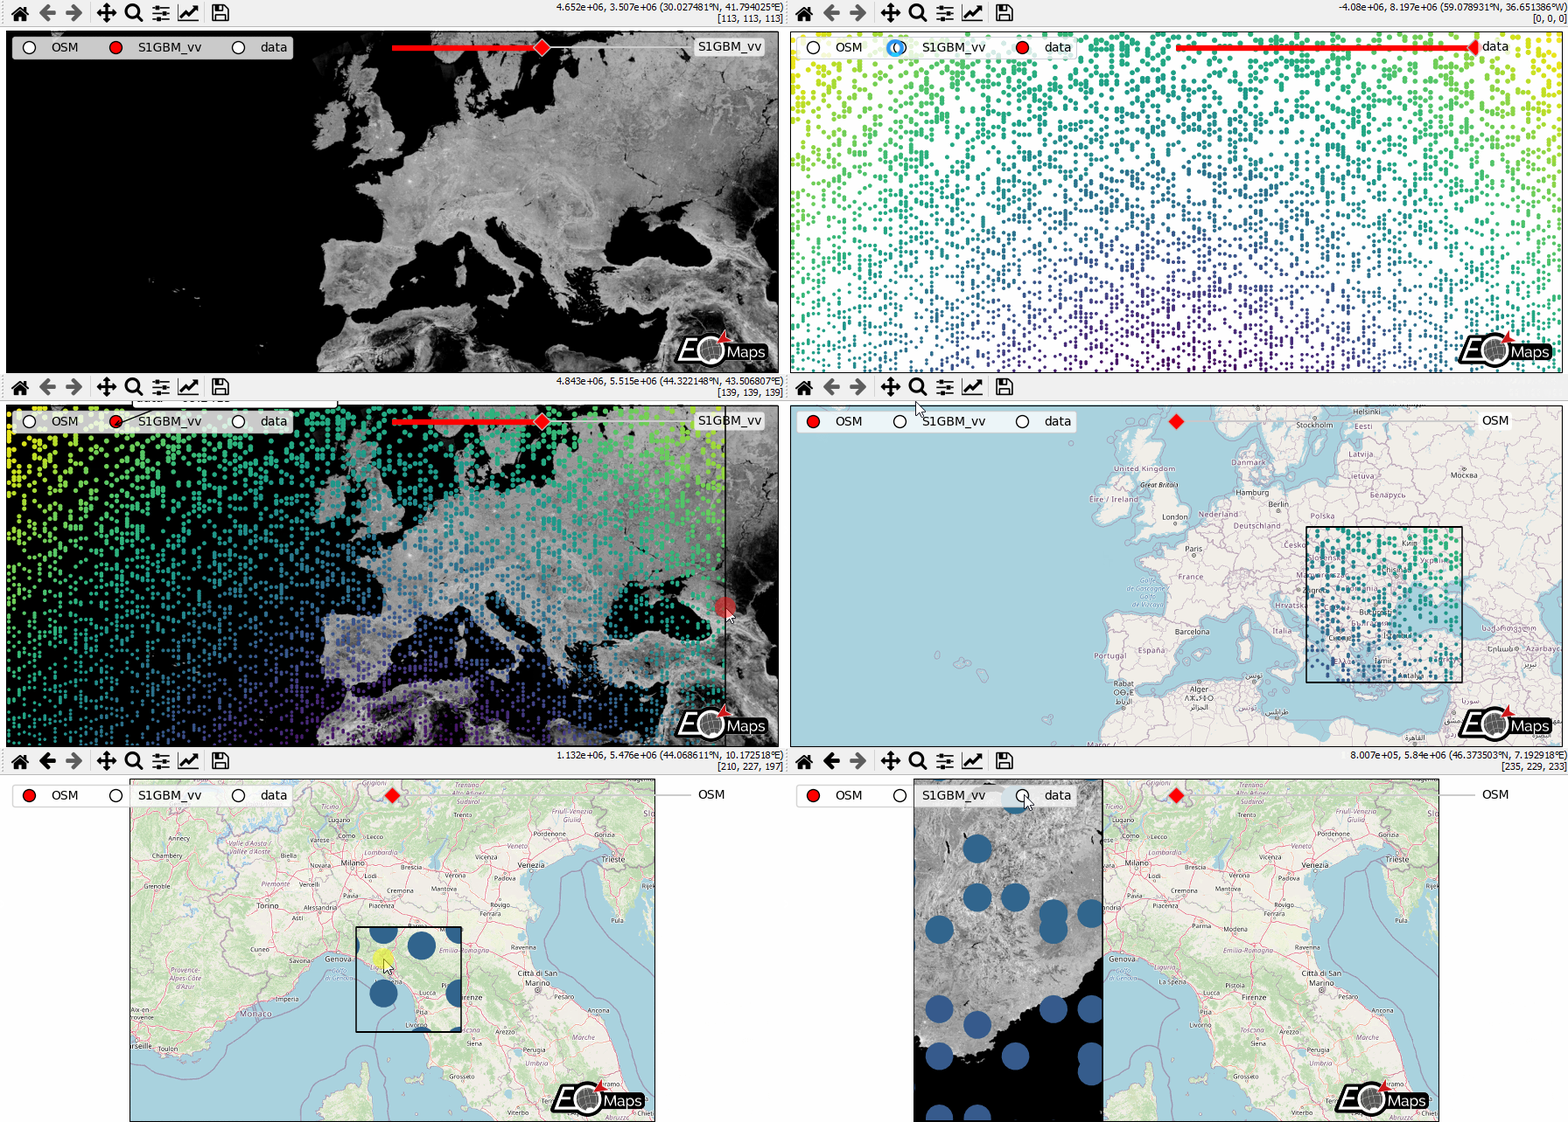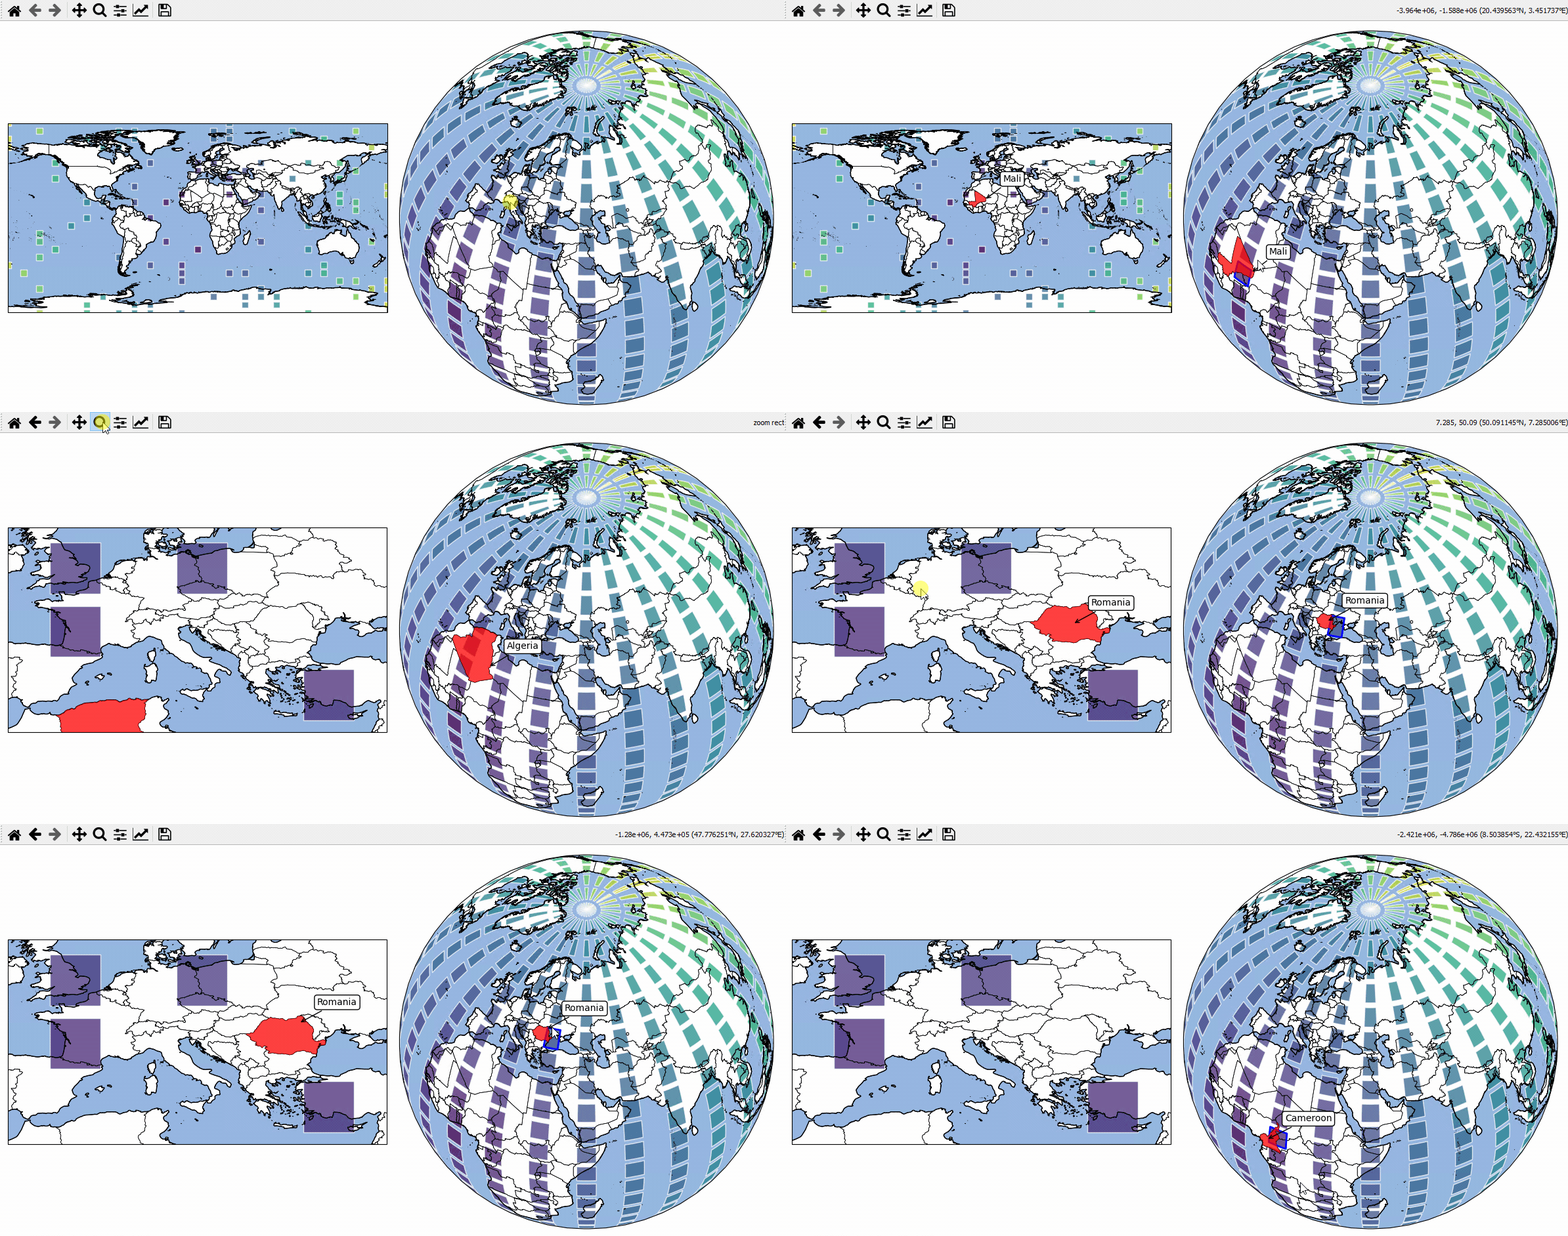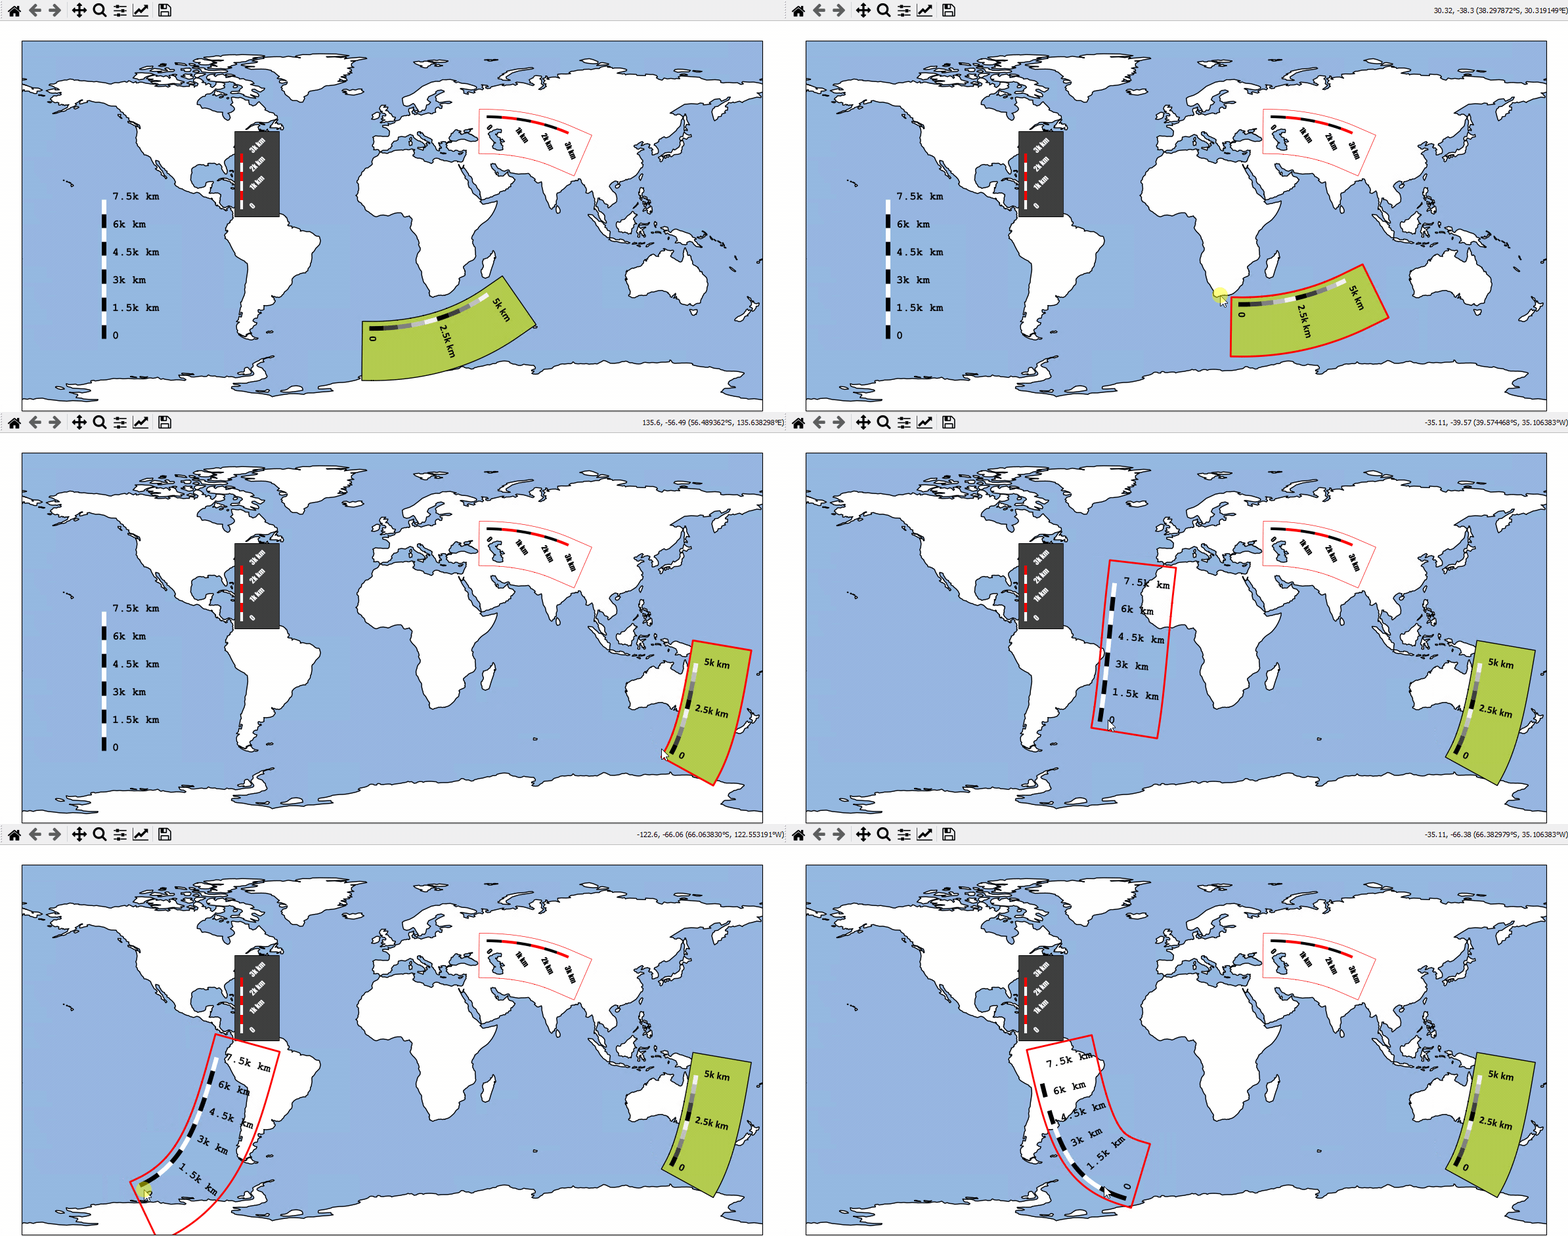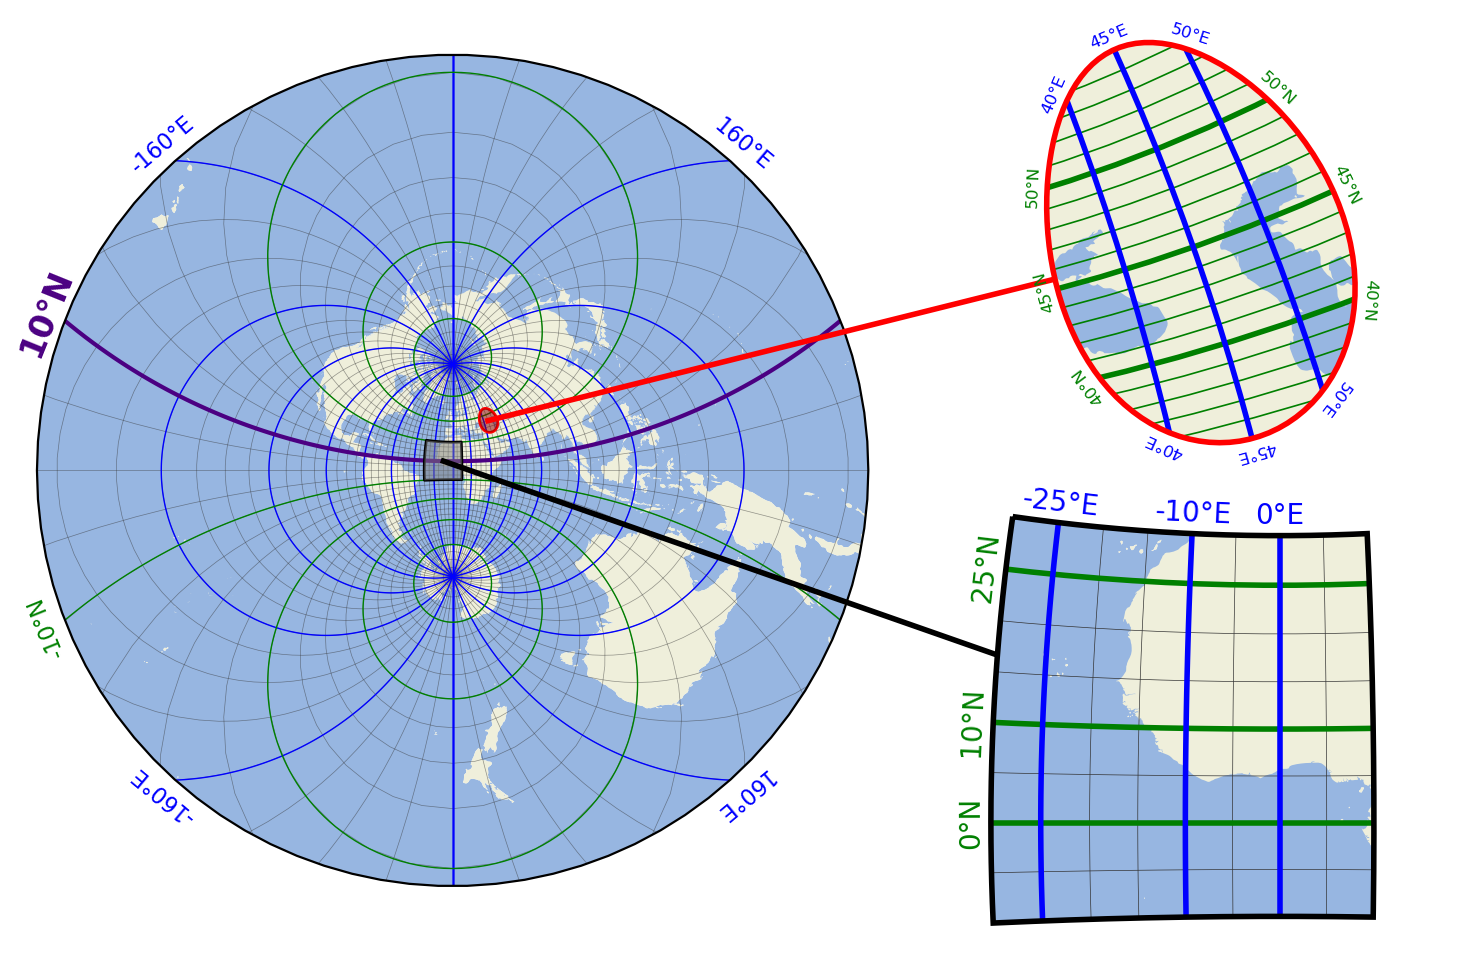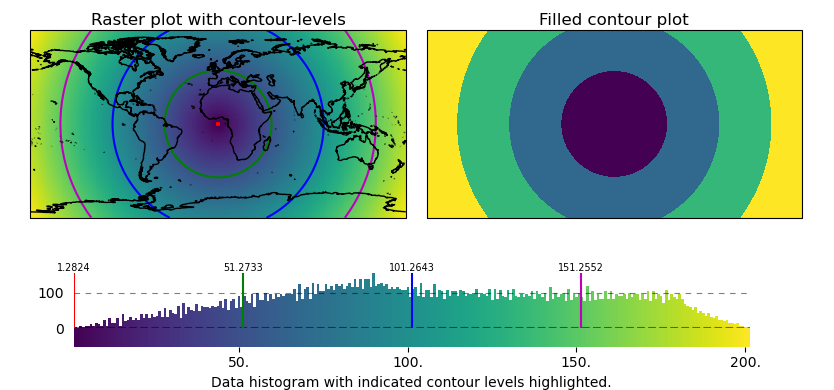
Welcome to the documentation for EOmaps!
Here you can find detailed explanations on all the features and functionalities of EOmaps.
Getting Started
To get started, have a look at the 🐛 Installation instructions and the 🌱 Basics section to learn how to use EOmaps!
In addition, there is also the 🧰 Companion Widget GUI that can be used to interactively edit/compare/overlay maps and explore the features and functionalities.
Data Visualization
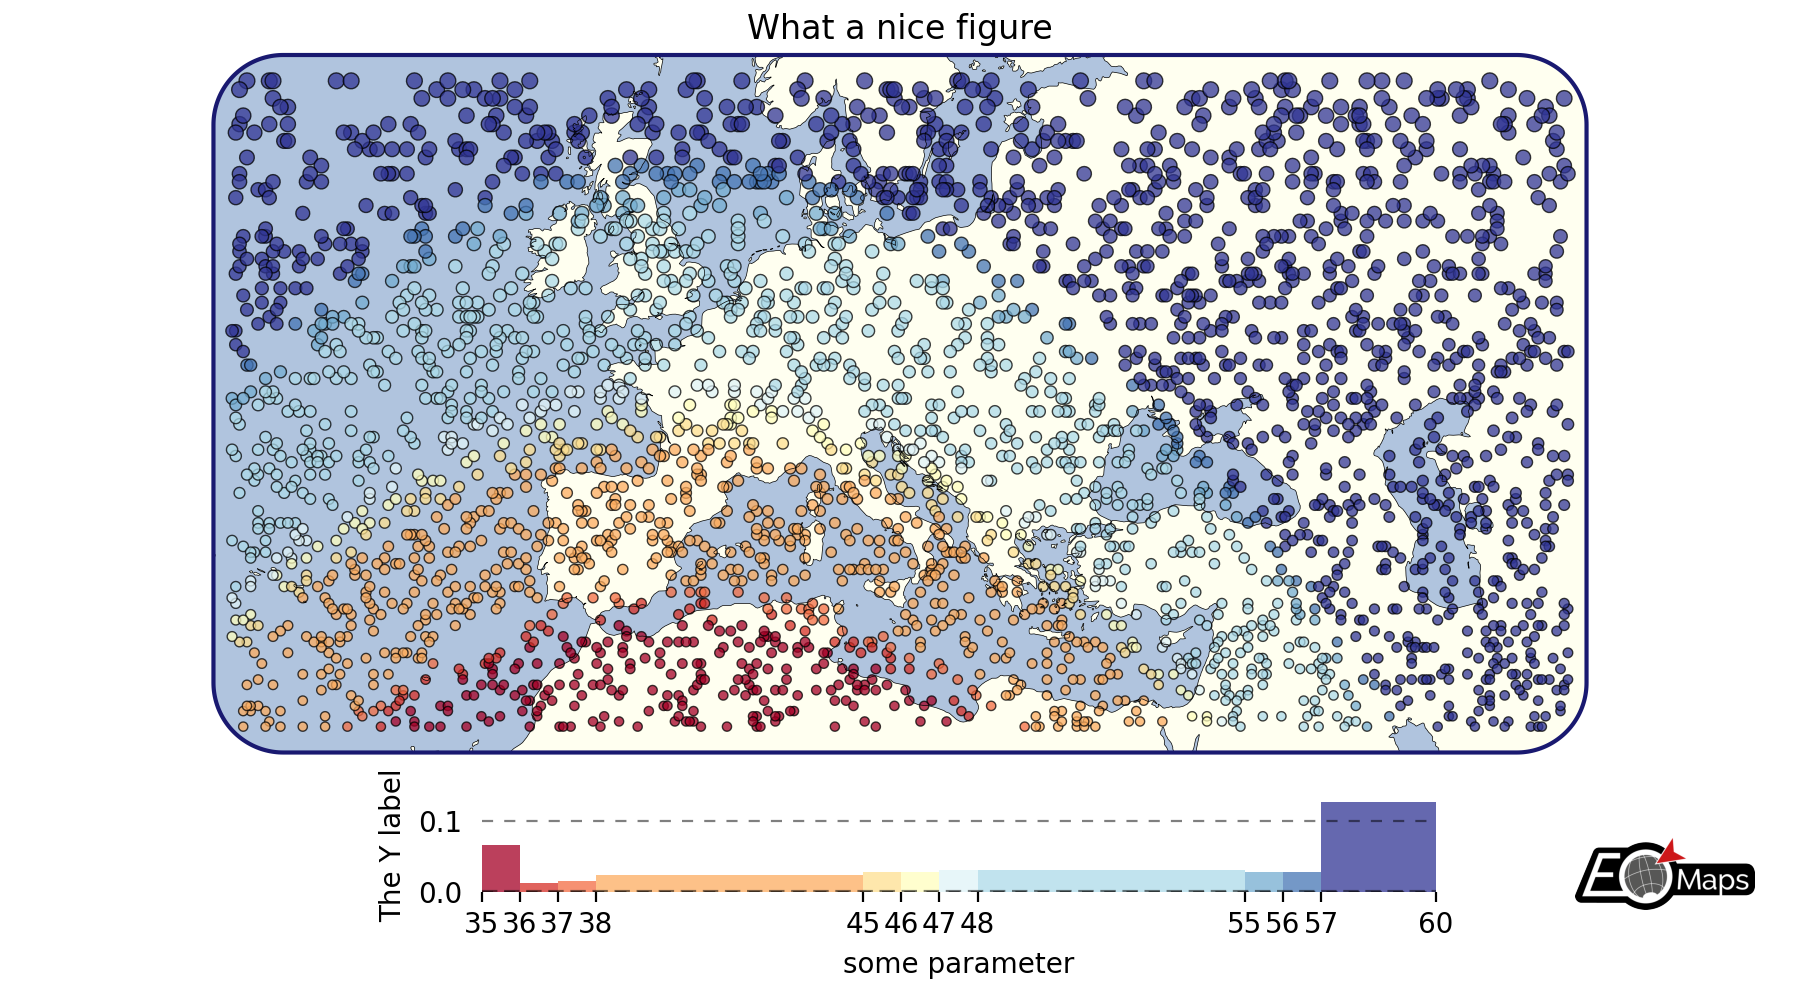
Want to visualize some data? Have a look at the 🔴 Data Visualization section to learn how to create beautiful maps with your datasets!
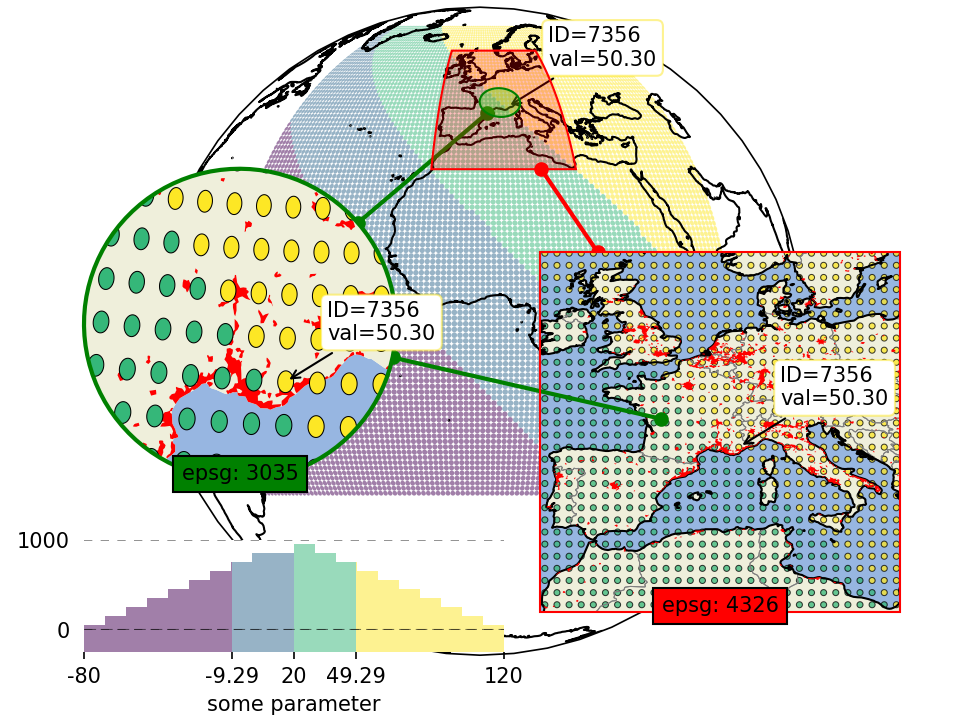
EOmaps provides a variety of plot-shapes so you can select a shape that suits the structure, size and spatial representativeness of your data:
Map Features
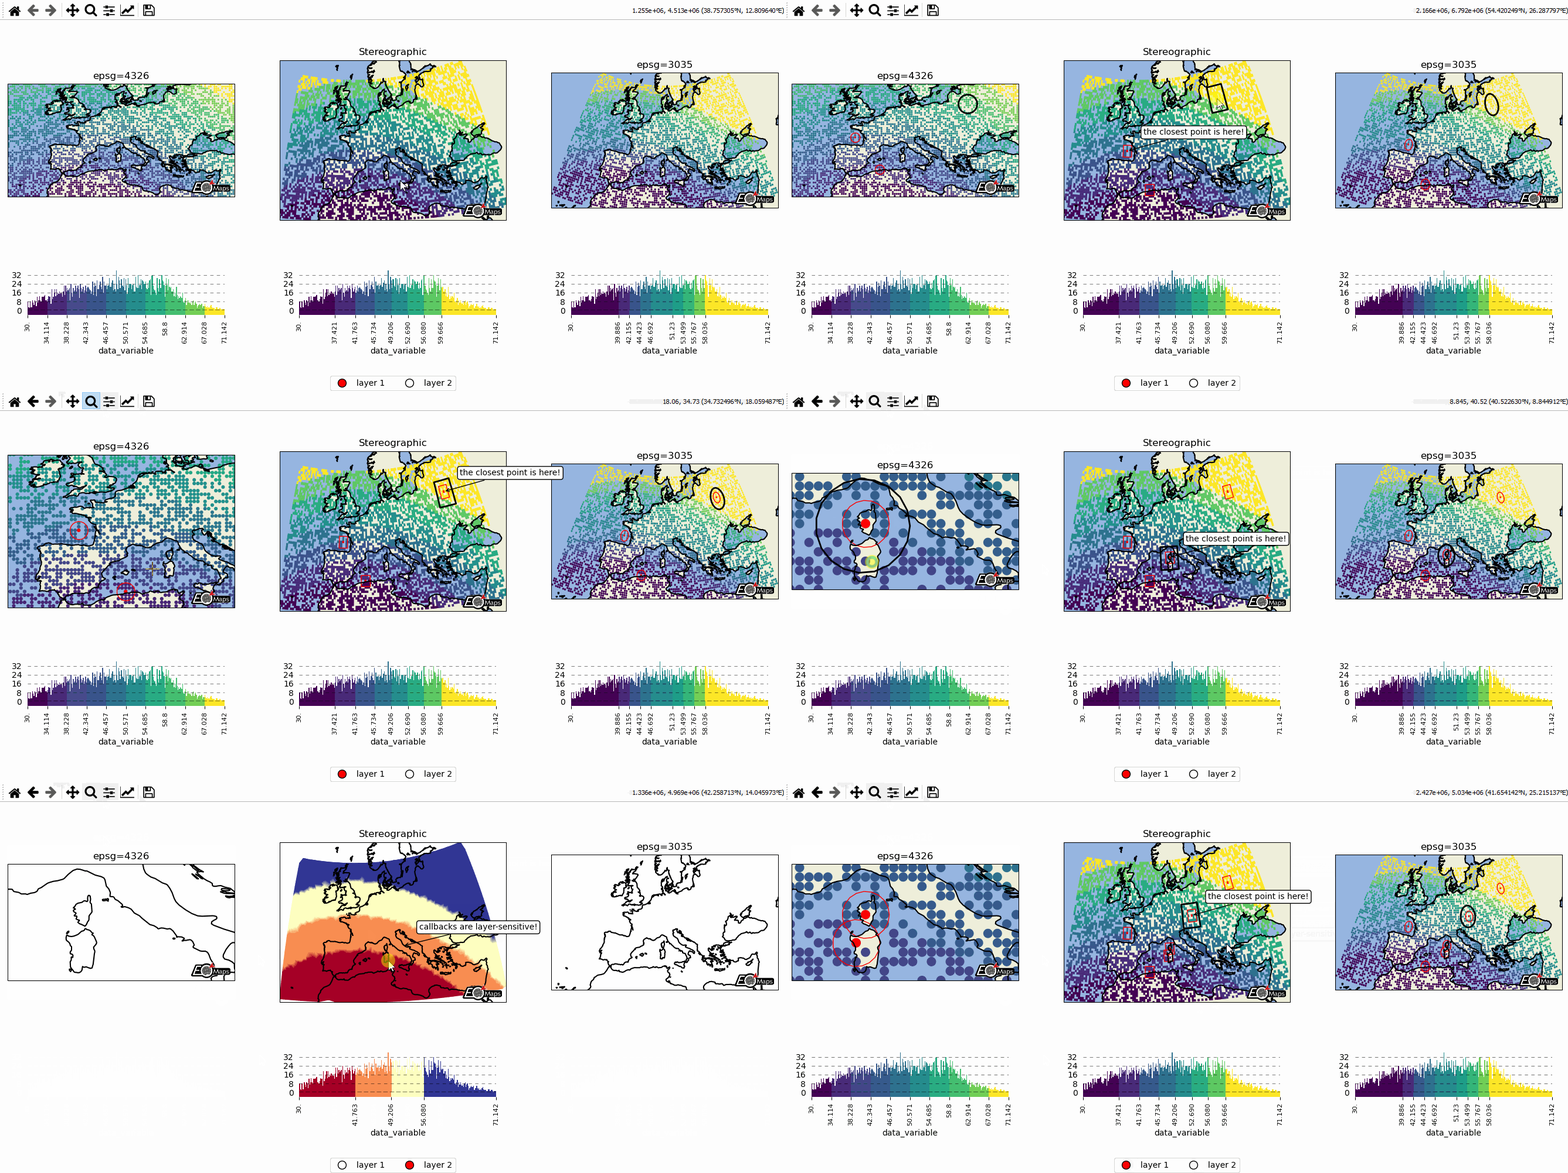
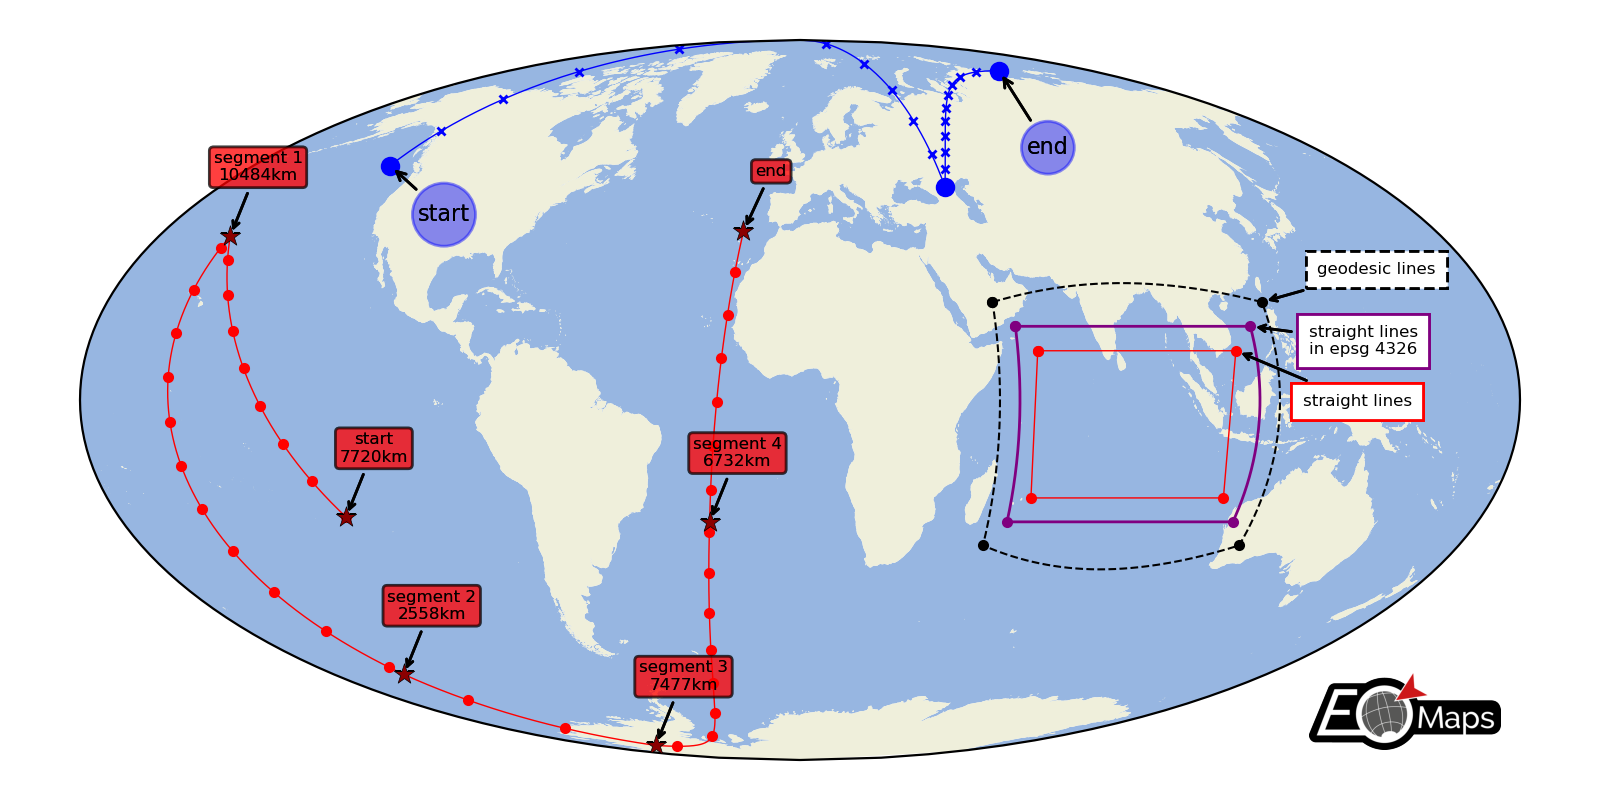
EOmaps provides many useful tools to customize your maps.
Interactivity
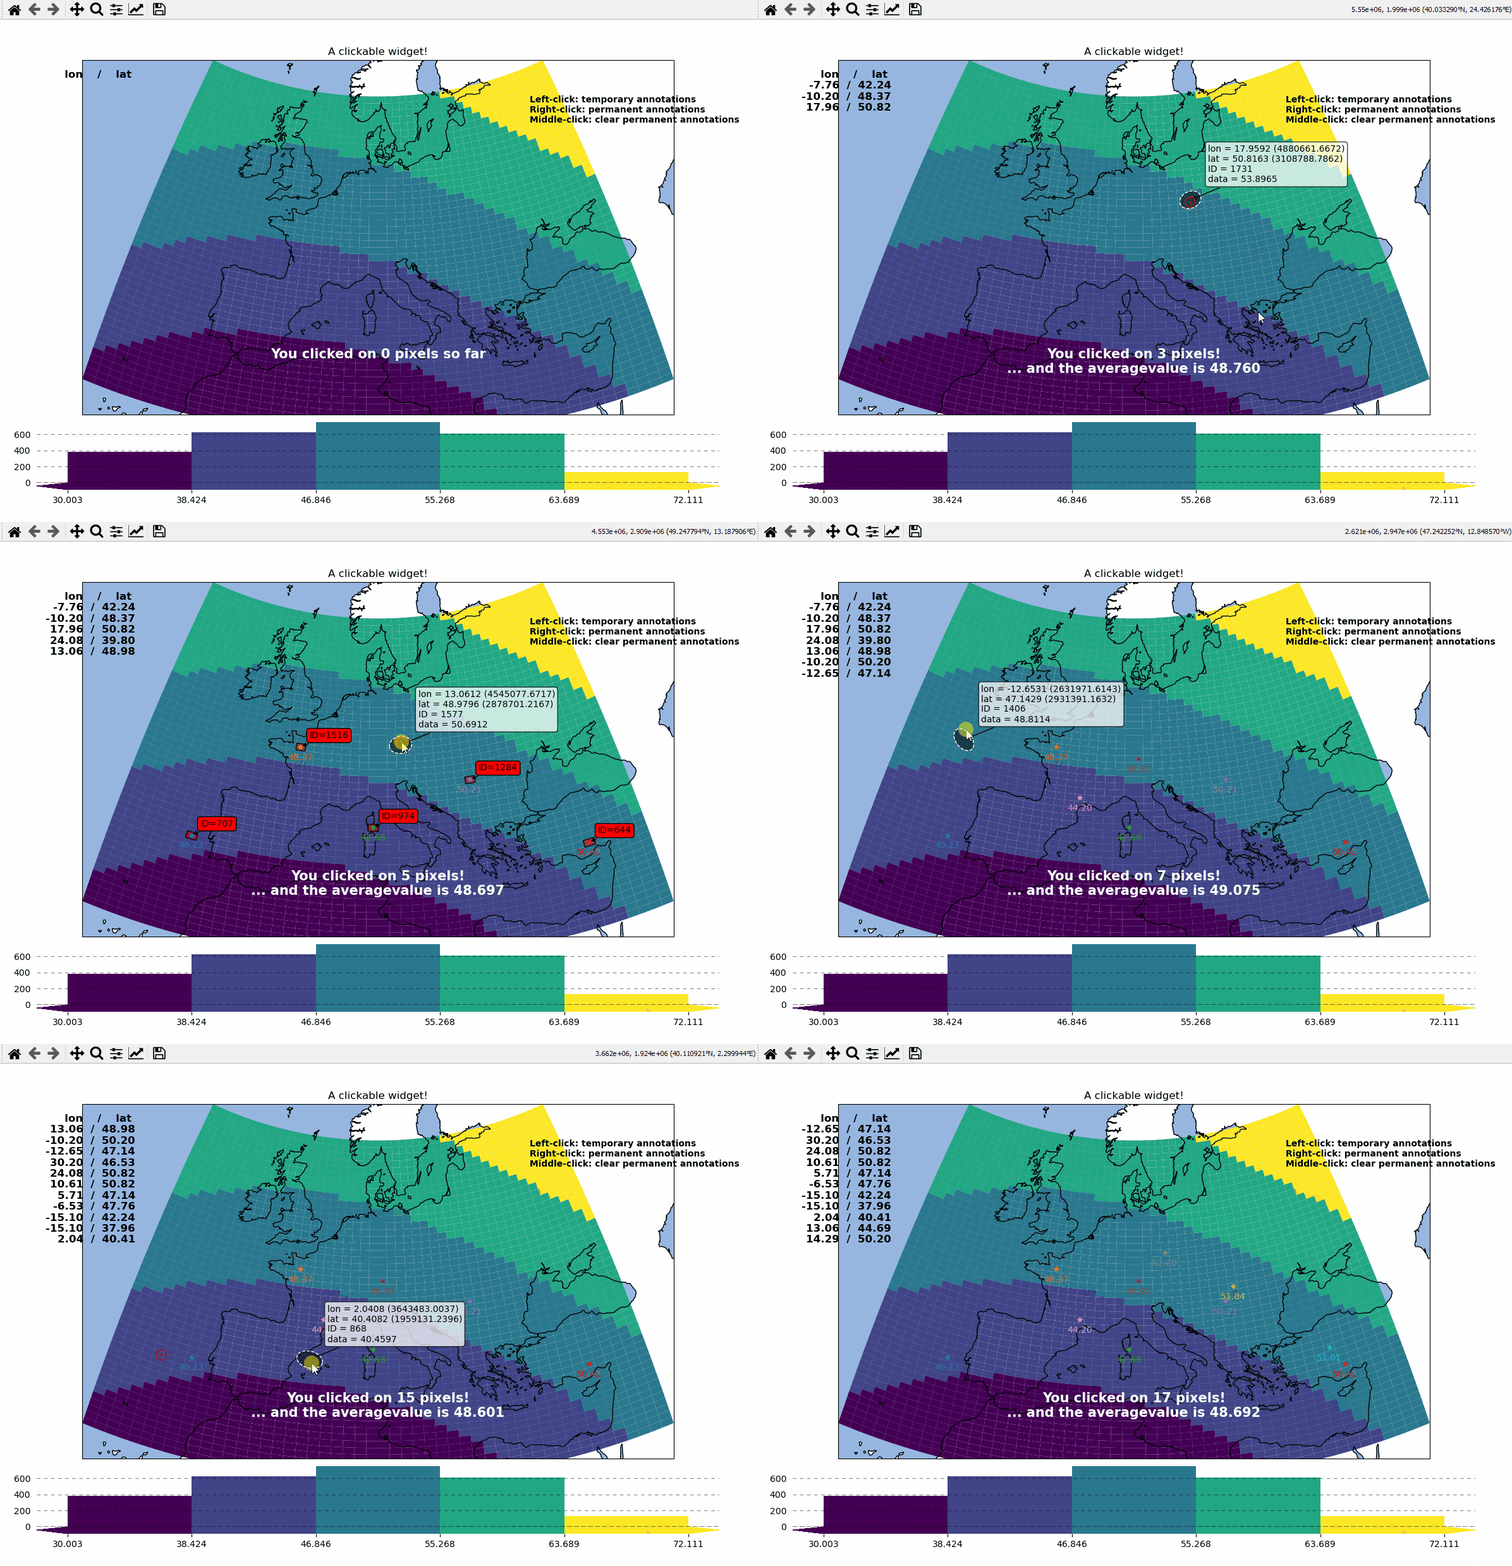
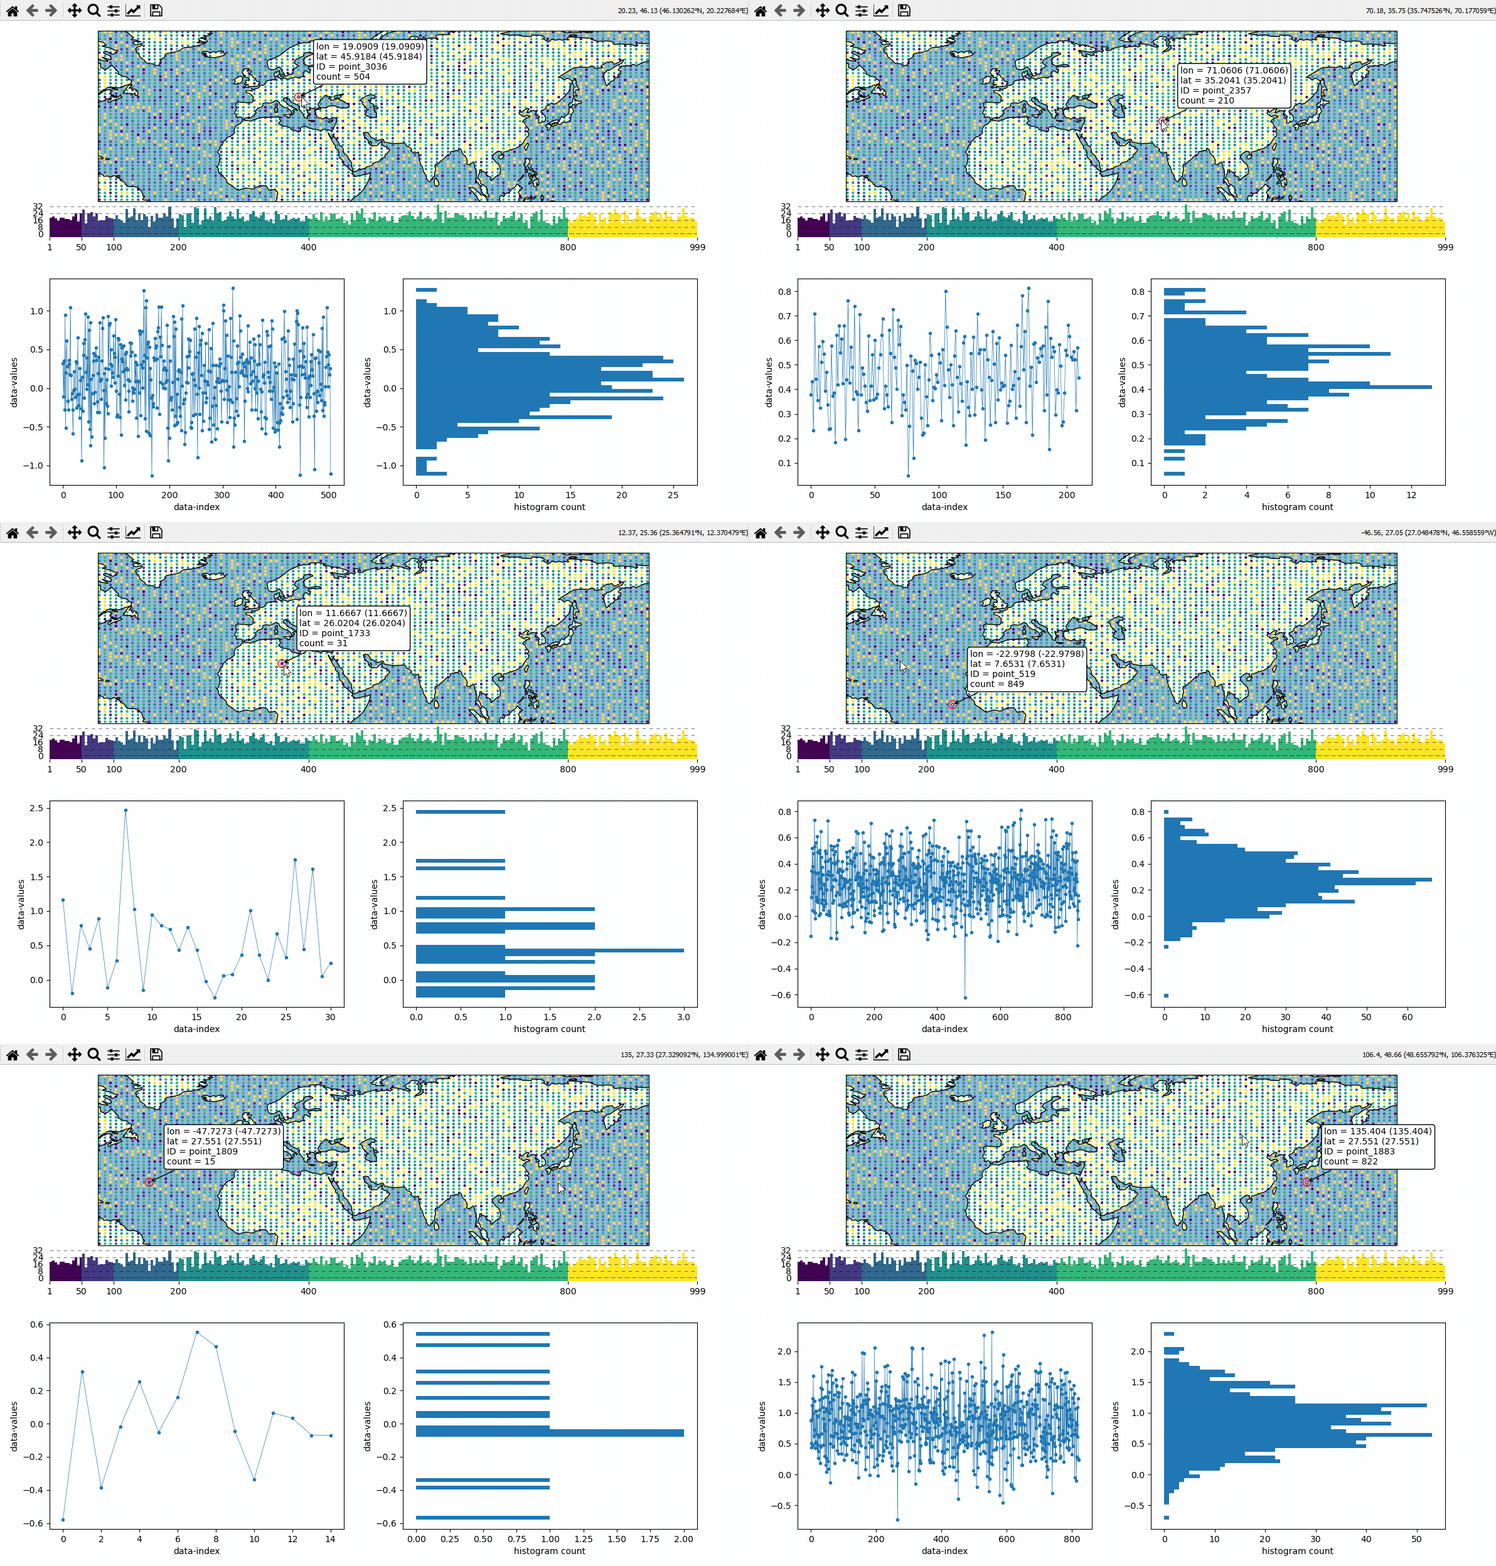
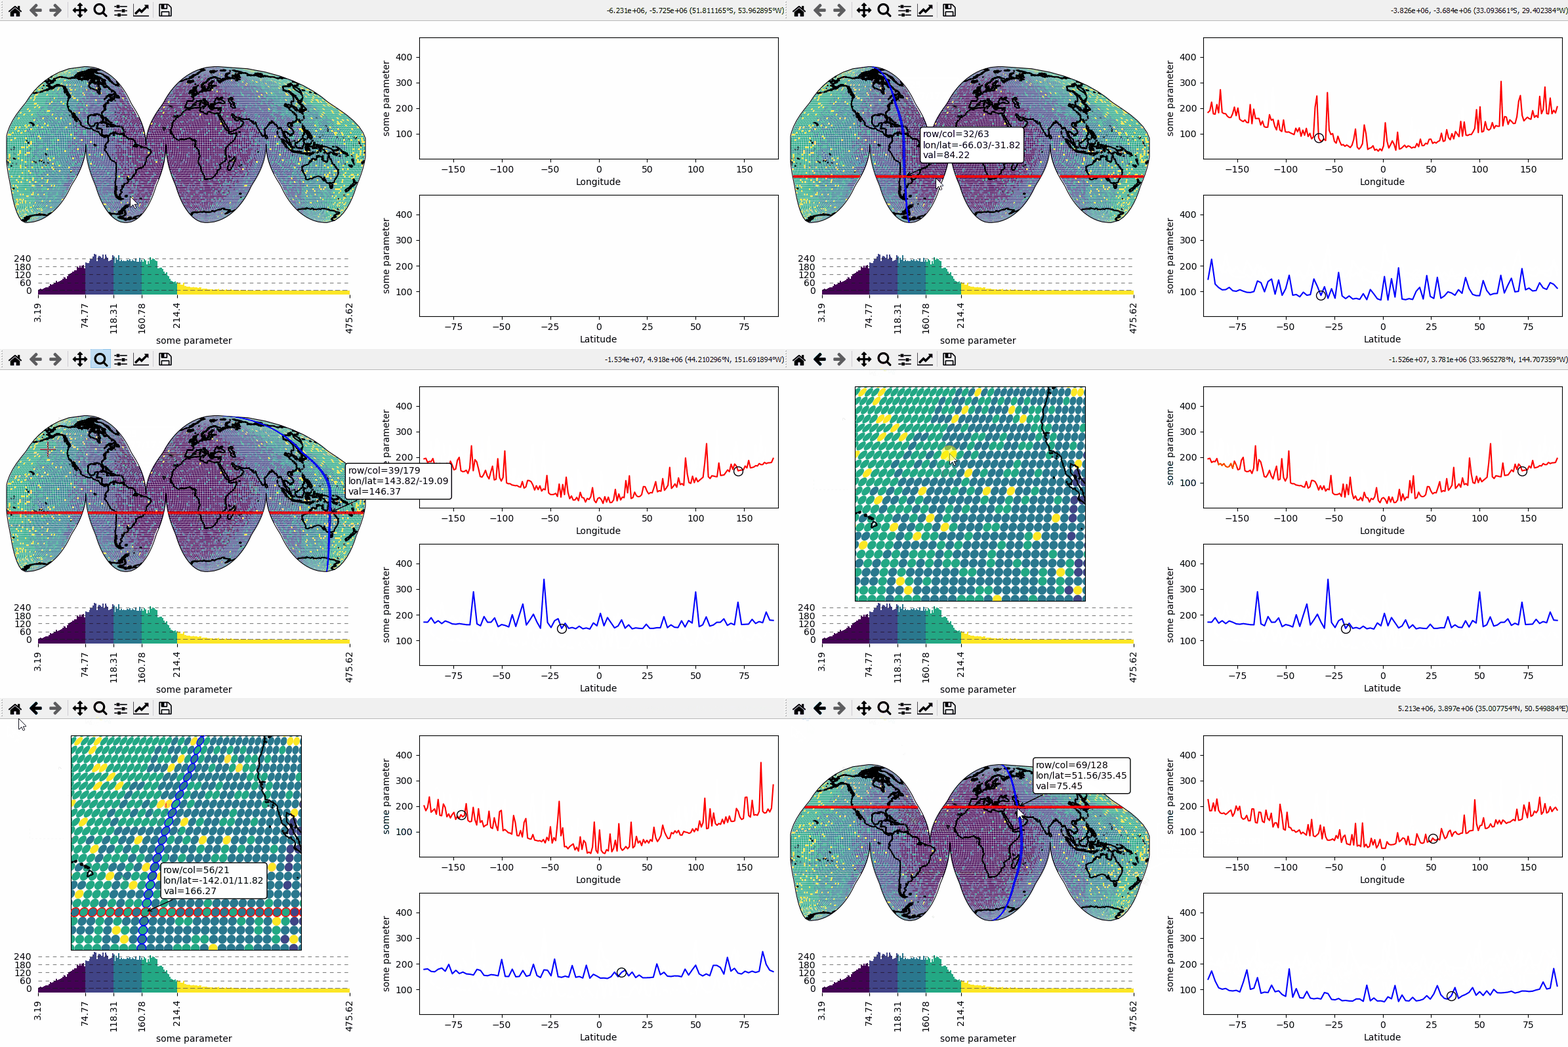
With a few lines of code, you can turn your maps into interactive data-analysis widgets!
Miscellaneous
API Reference
Examples
Make sure to check out the Examples for an overview of the capabilities (incl. source code)!
