Welcome to the documentation for EOmaps!
Here you can find detailed explanations on all the functionalities of EOmaps.
Interested in contributing to EOmaps?
Getting Started
To get started, have a look at the 🌱 Basics section to get to know the basic concepts of EOmaps.
In addition, there is also the 🧰 Companion Widget GUI that can be used to interactively edit/compare/overlay maps and explore the features and functionalities.
Data Visualization
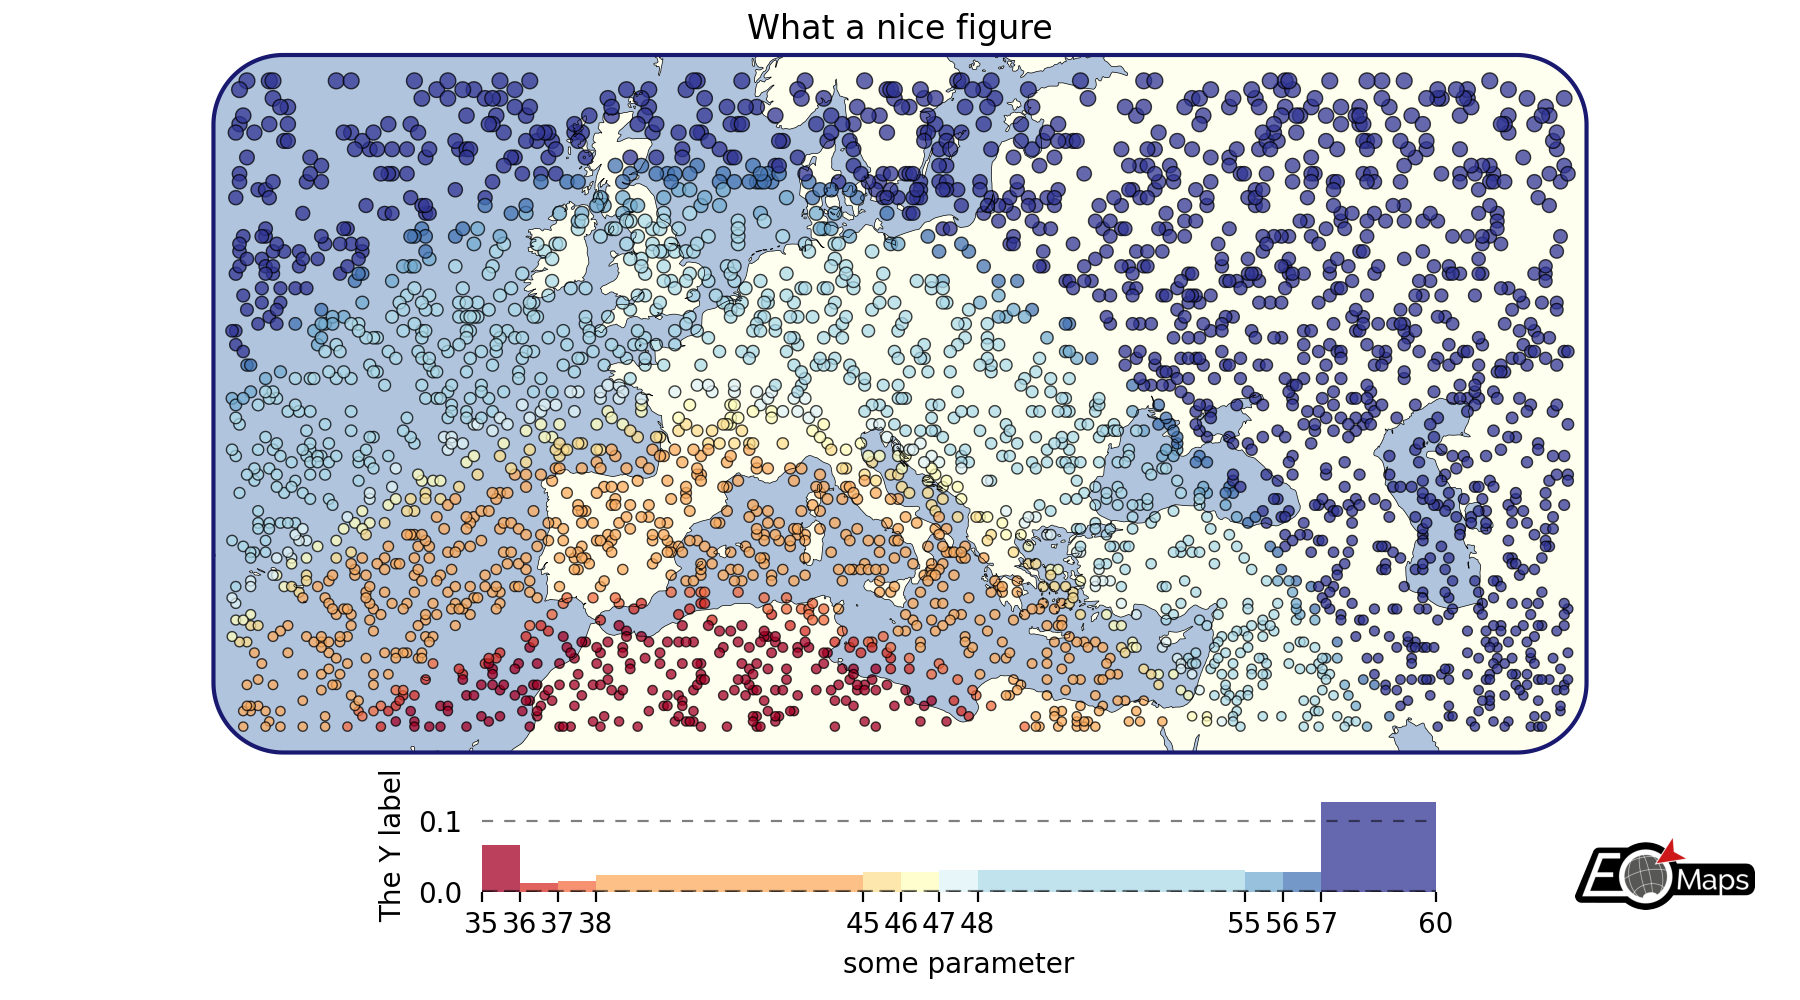
Want to visualize some data? Have a look at the 🔴 Data Visualization section to learn how to create beautiful maps with your datasets!
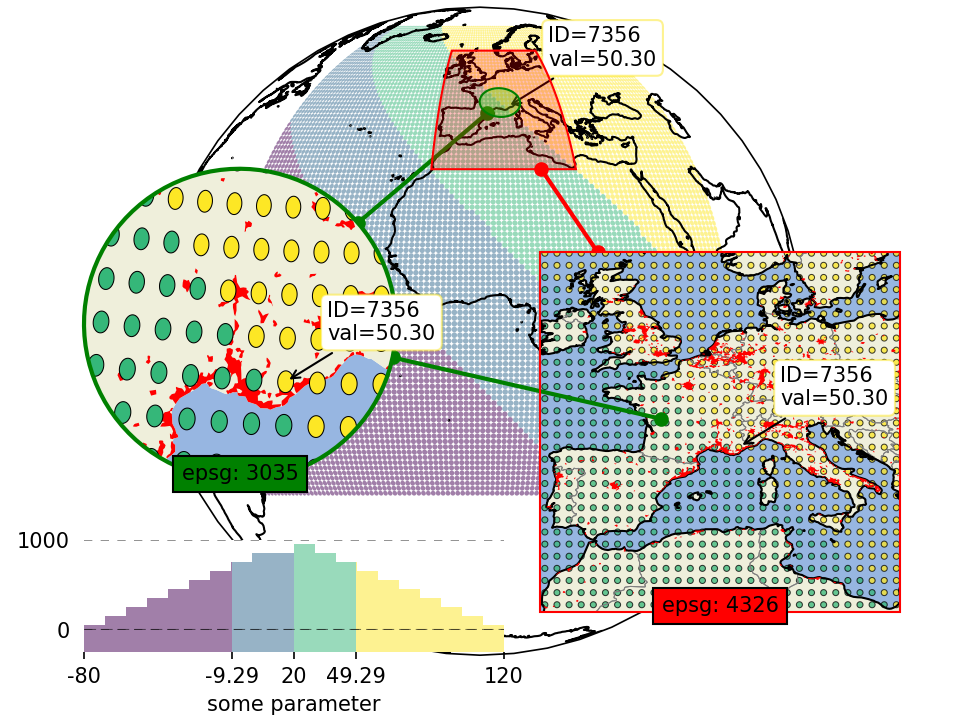
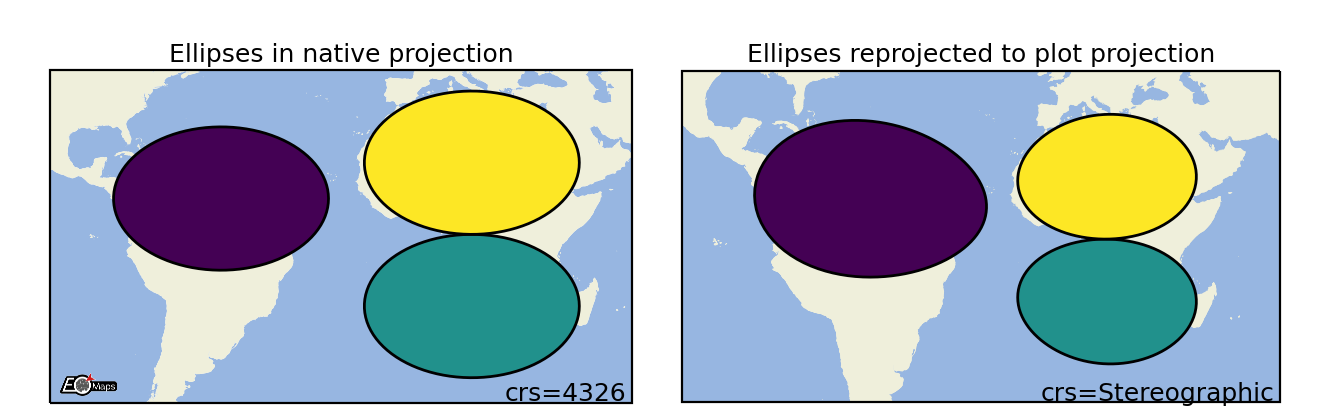
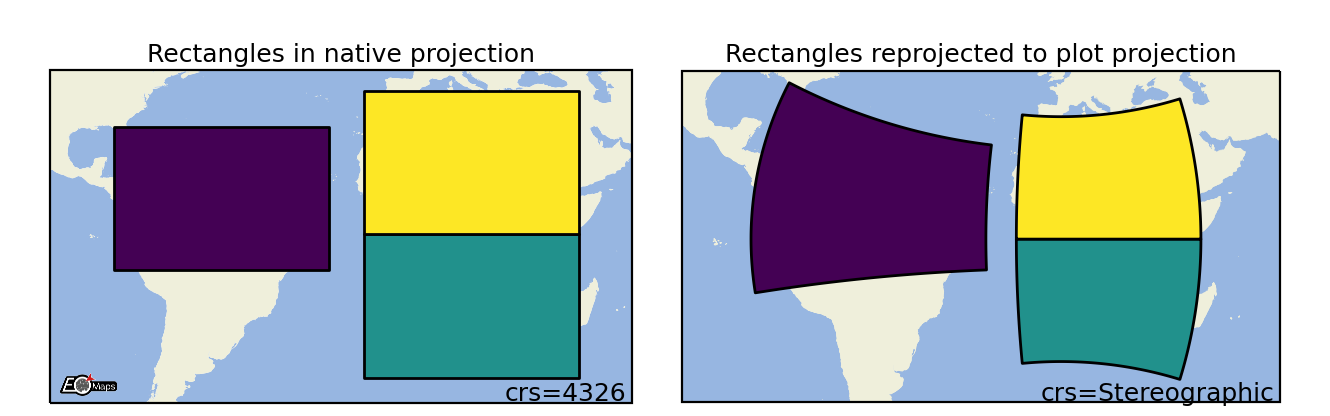
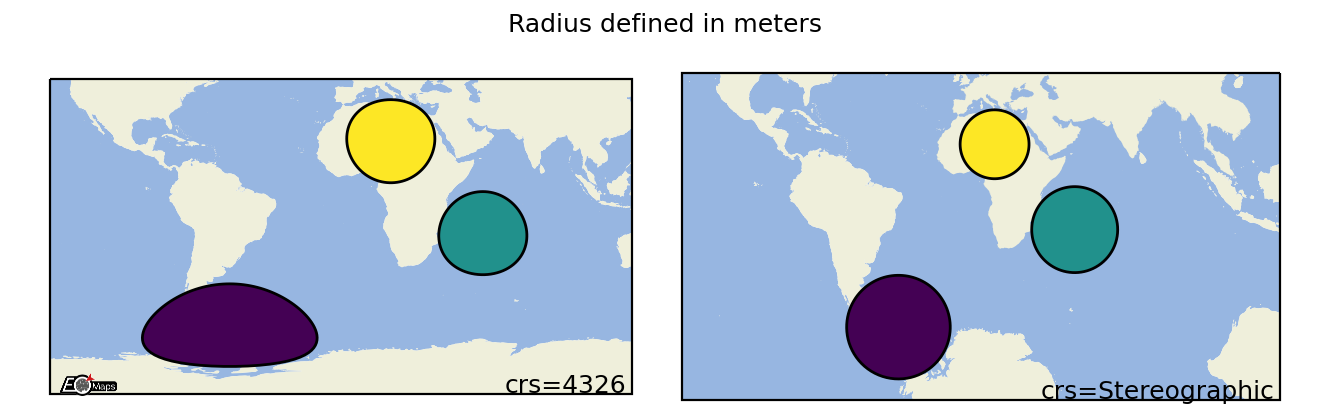
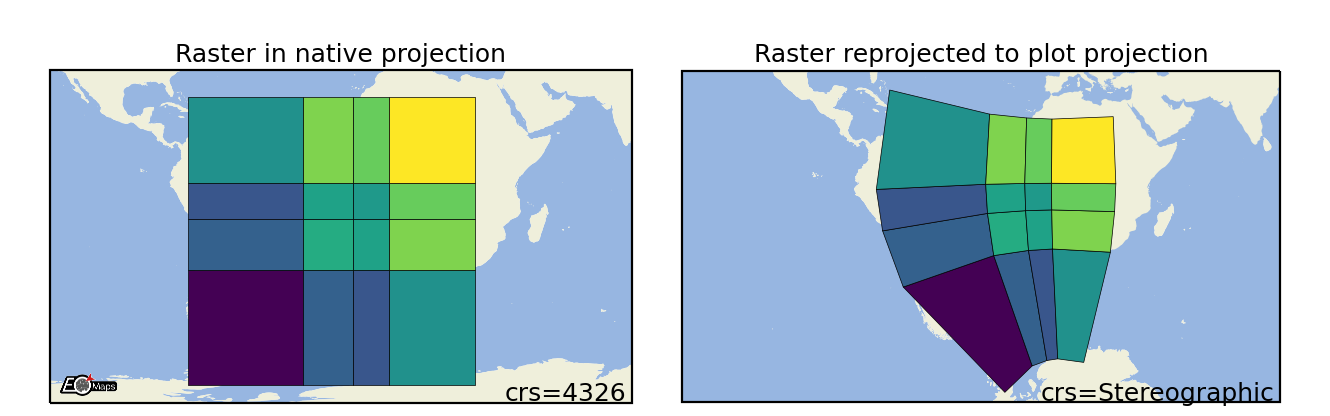
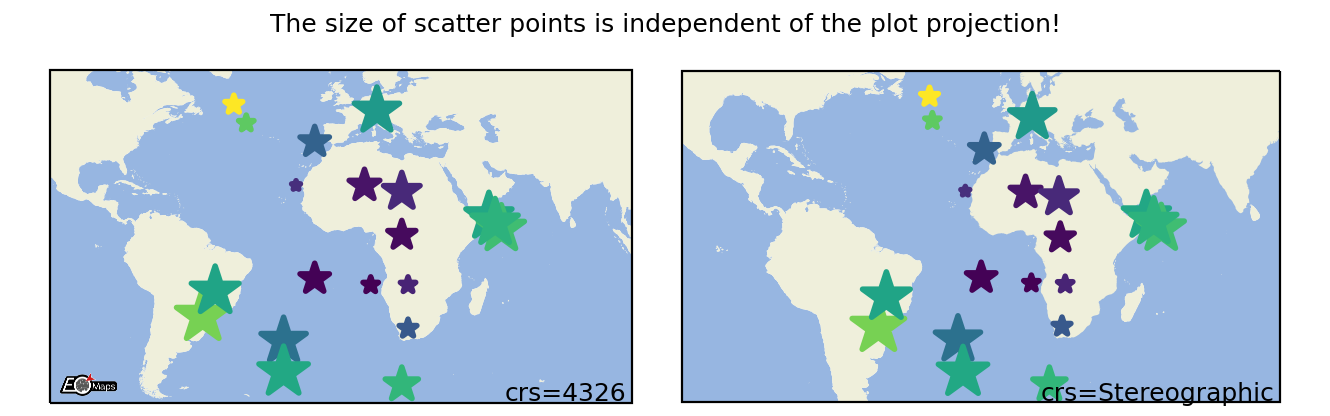
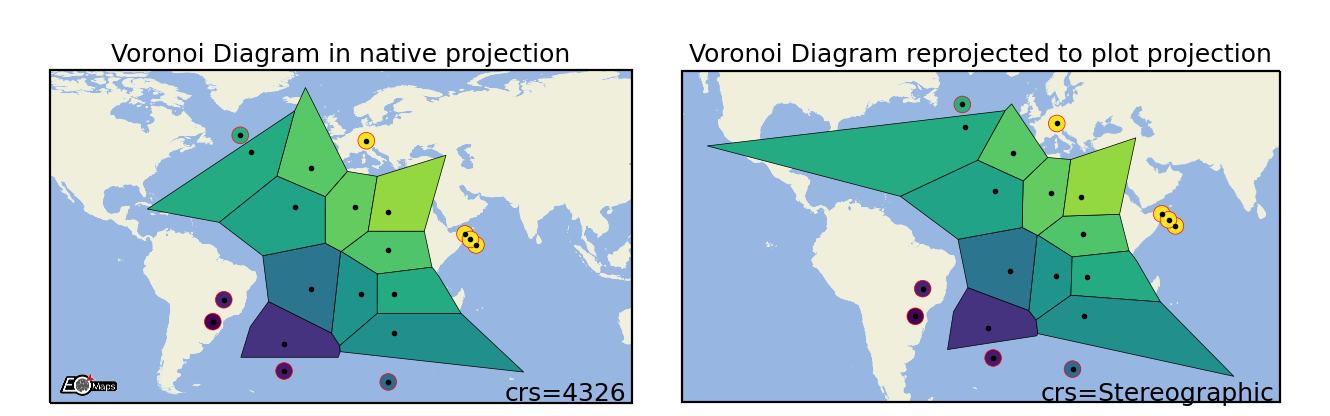
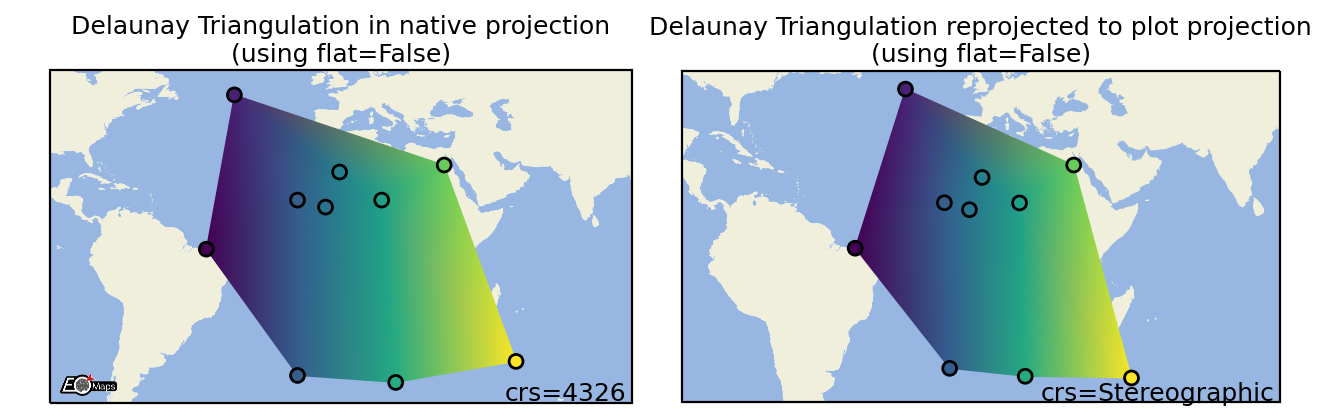
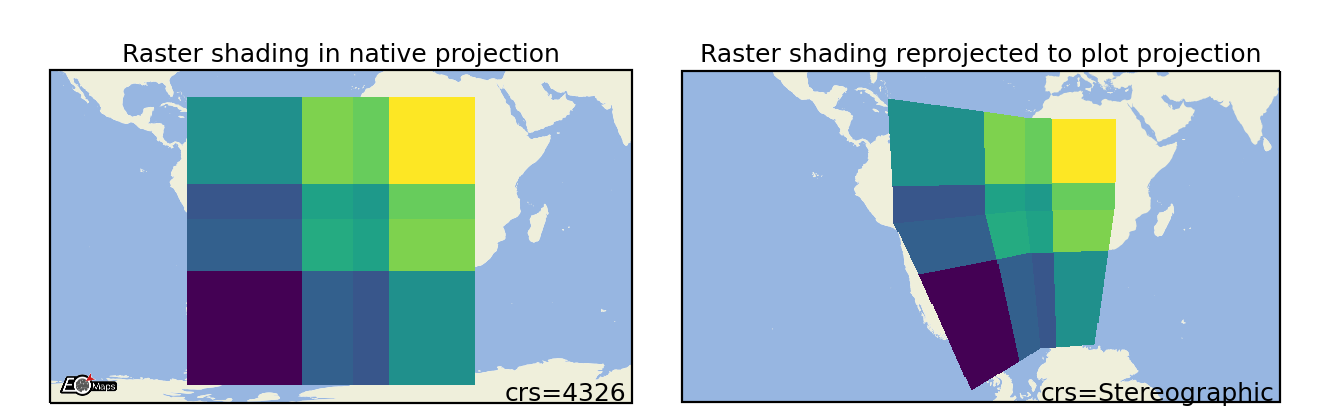
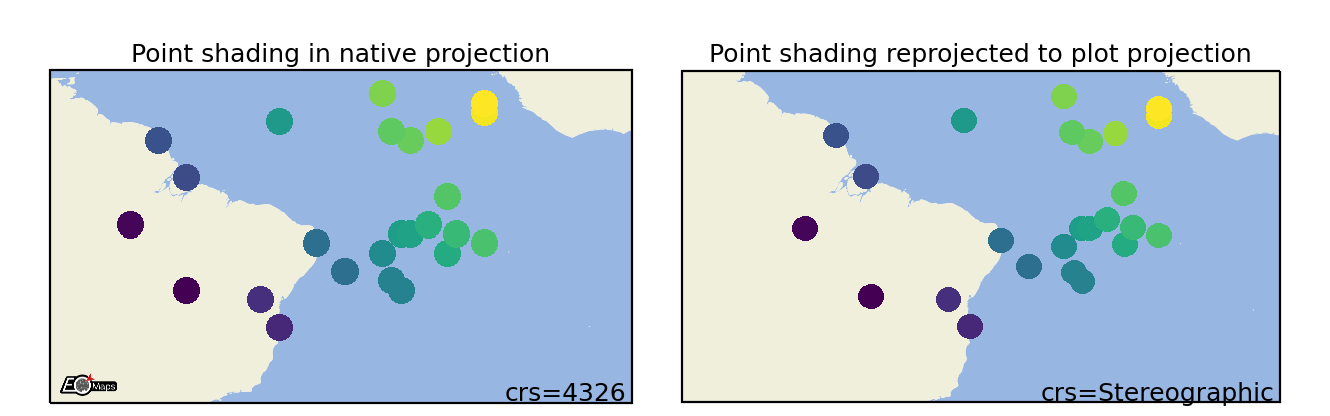
EOmaps provides a variety of plot-shapes so you can select a shape that suits the structure, size and spatial representativeness of your data:
| Ellipses | Rectangles | Geodesic Circles | Raster | Scatter Points |
|---|---|---|---|---|
 |
 |
 |
 |
 |
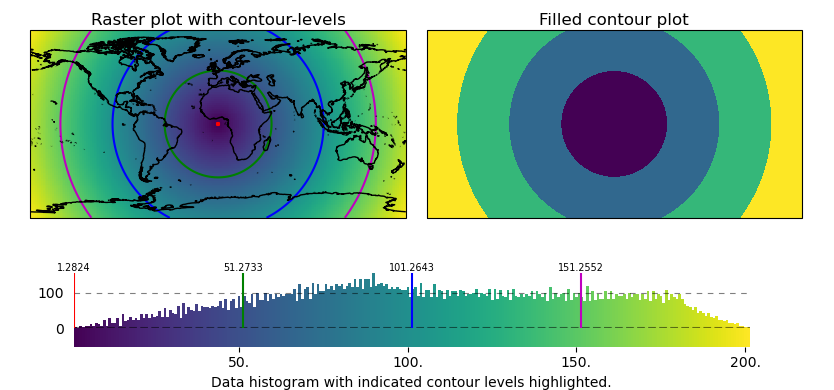
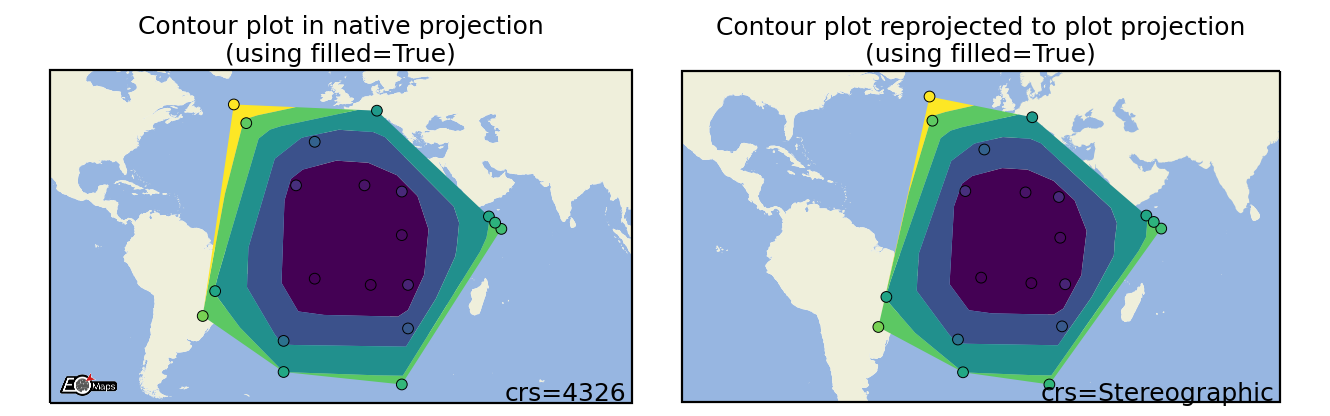
| Contour | Voronoi Diagram | Delaunay Triangulation | Shade Raster | Shade Points |
 |
 |
 |
 |
 |
Map Features
EOmaps provides many useful tools to customize your maps.
Create zoomed-in views on specific regions of a map.
|
Add basic map features (coastlines, ocean-coloring etc. ) to the map.
|
Add imagery provided by WebMap services (ts, wms, wmts, xyz) to the map.
|
Add vector geometries to the map.
|
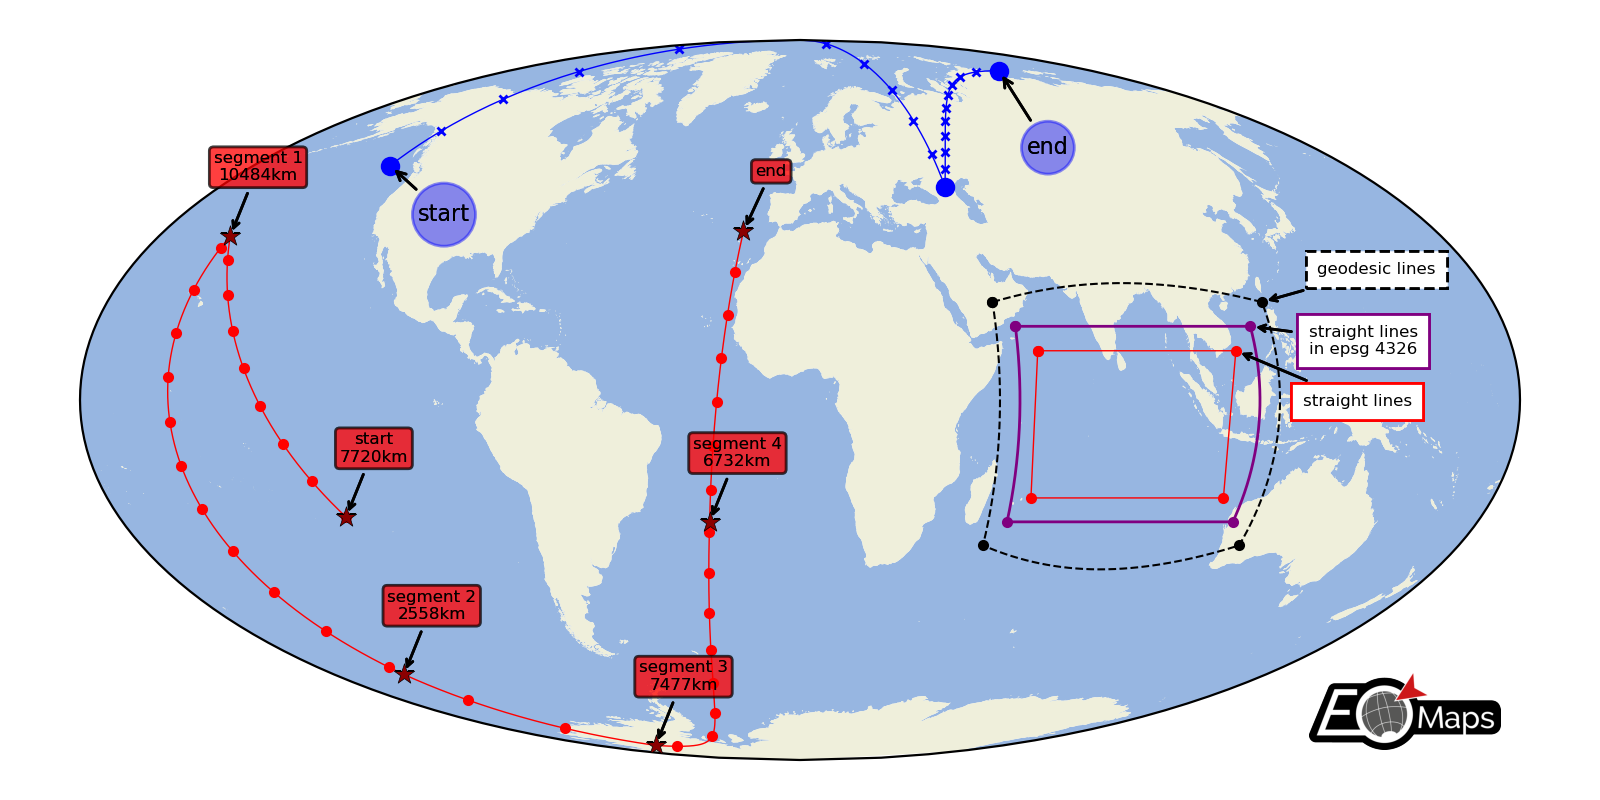
Add markers, annotations, lines, logos etc. to the map.
|
Add a scalebar to the map.
|
Add a compass (or North Arrow) to the map.
|
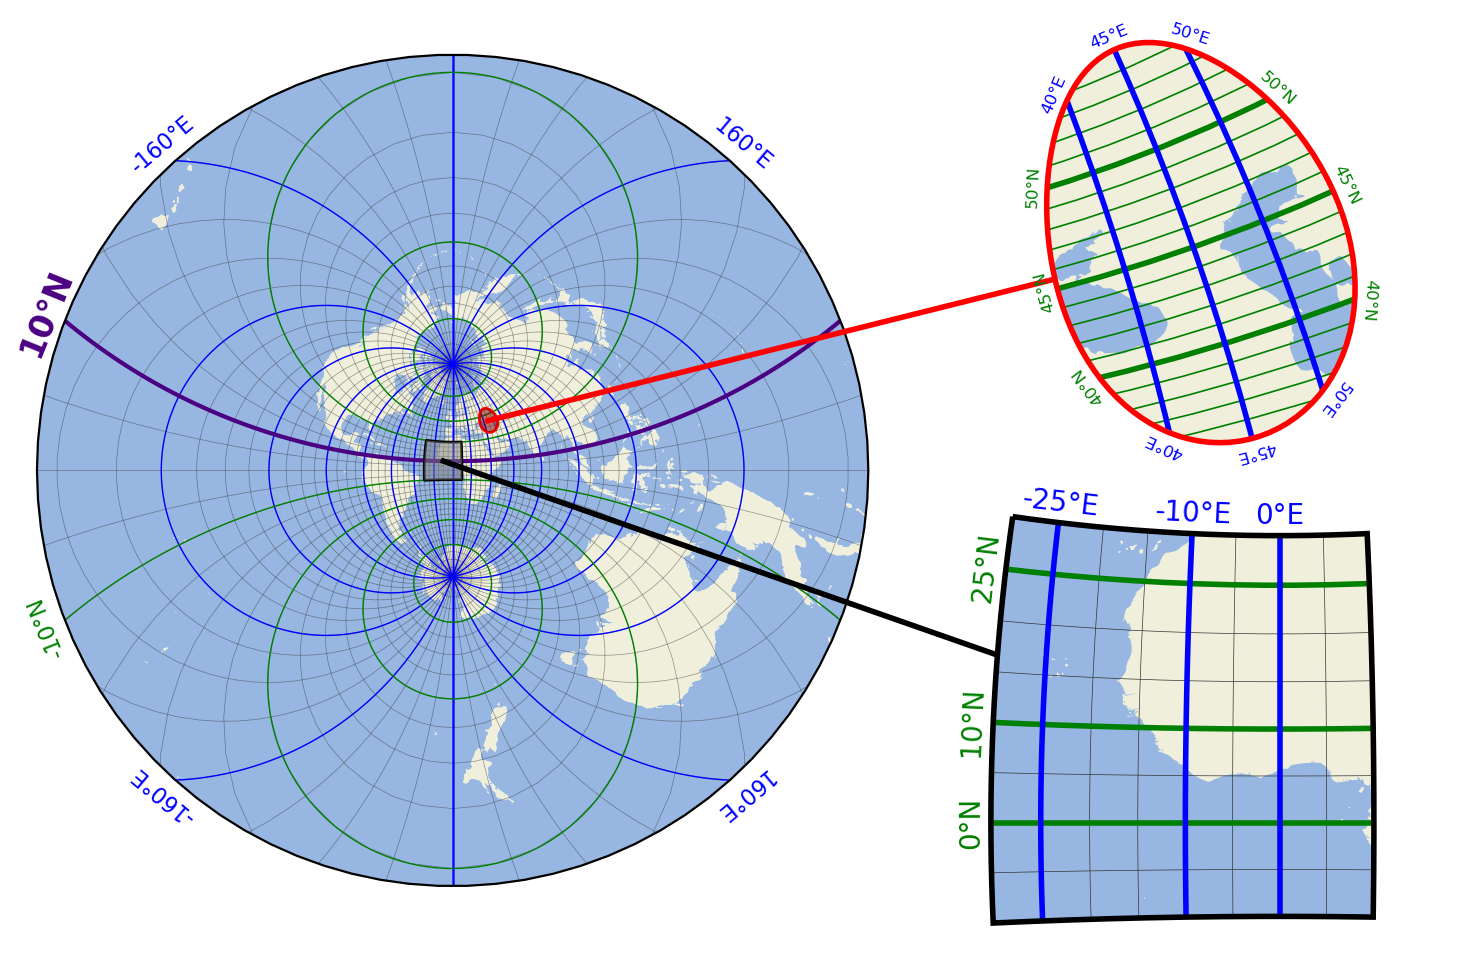
Add grid-lines (and optionally grid-labels) to the map.
|
Interactivity
With a few lines of code, you can turn your maps into interactive data-analysis widgets!
A graphical user-interface to interact with the map.
|
Turn your maps into interactive data-analysis widgets.
|
Interactively re-arrange and re-size axes of a figure.
|
Interactively draw geometries on a map and export them as shapefiles.
|
A collection of utility widgets (layer-sliders, layer-selectors)
|
Miscellaneous
Details on logging.
|
How to use the command-line interface eomaps.
|
Read data from NetCDF, GeoTIFF or CSV files.
|
Additional functions and properties that might come in handy.
|
Examples
Make sure to check out the 🗺 EOmaps examples for an overview of the capabilities (incl. source code)!
|
|
|
|
|
|
|
|
|
|
|
|
|
|
… |