Customize the appearance of the plot#
use
m.set_plot_specs()to set the general appearance of the plotafter creating the plot, you can access individual objects via
m.figure.<...>… most importantly:f: the matplotlib figureax,ax_cb,ax_cb_plot: the axes used for plotting the map, colorbar and histogramgridspec,cb_gridspec: the matplotlib GridSpec instances for the plot and the colorbarcoll: the collection representing the data on the map
# EOmaps example: Customize the appearance of the plot
from eomaps import Maps
import pandas as pd
import numpy as np
# ----------- create some example-data
lon, lat = np.meshgrid(np.arange(-30, 60, 0.25), np.arange(30, 60, 0.3))
data = pd.DataFrame(
dict(lon=lon.flat, lat=lat.flat, data_variable=np.sqrt(lon**2 + lat**2).flat)
)
data = data.sample(3000) # take 3000 random datapoints from the dataset
# ------------------------------------
m = Maps(crs=3857, figsize=(9, 5))
m.set_frame(rounded=0.2, lw=1.5, ec="midnightblue", fc="ivory")
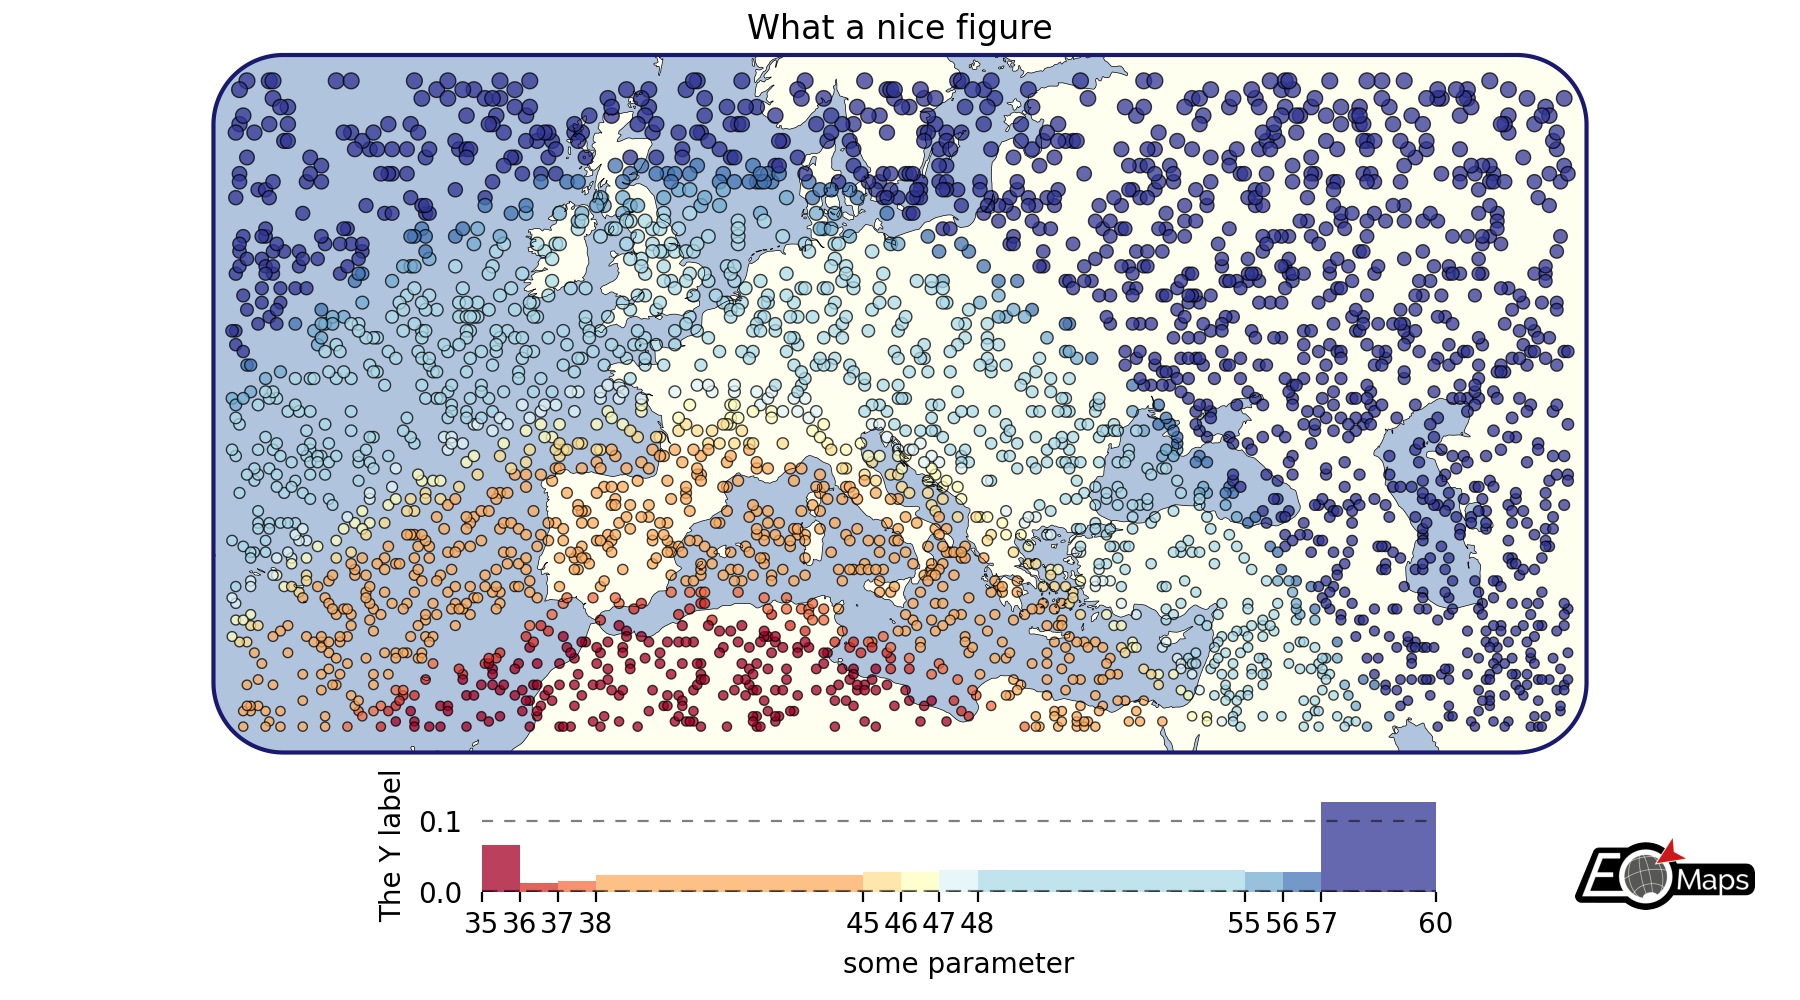
m.text(0.5, 0.97, "What a nice figure", fontsize=12)
m.add_feature.preset.ocean(fc="lightsteelblue")
m.add_feature.preset.coastline(lw=0.25)
m.set_data(data=data, x="lon", y="lat", crs=4326)
m.set_shape.geod_circles(radius=30000) # plot geodesic-circles with 30 km radius
m.set_classify_specs(
scheme="UserDefined", bins=[35, 36, 37, 38, 45, 46, 47, 48, 55, 56, 57, 58]
)
m.plot_map(
edgecolor="k", # give shapes a black edgecolor
linewidth=0.5, # with a linewidth of 0.5
cmap="RdYlBu", # use a red-yellow-blue colormap
vmin=35, # map colors to values between 35 and 60
vmax=60,
alpha=0.75, # add some transparency
)
# add a colorbar
m.add_colorbar(
label="some parameter",
hist_bins="bins",
hist_size=1,
hist_kwargs=dict(density=True),
)
# add a y-label to the histogram
m.colorbar.ax_cb_plot.set_ylabel("The Y label")
# add a logo to the plot
m.add_logo()
m.apply_layout(
{
"figsize": [9.0, 5.0],
"0_map": [0.10154, 0.2475, 0.79692, 0.6975],
"1_cb": [0.20125, 0.0675, 0.6625, 0.135],
"1_cb_histogram_size": 1,
"2_logo": [0.87501, 0.09, 0.09999, 0.07425],
}
)
m.show()