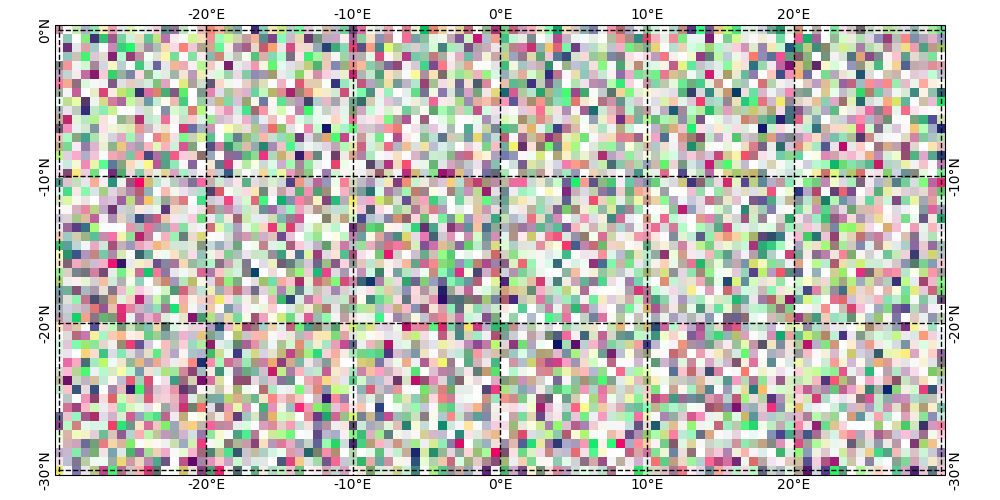
Plot RGB images on a map#
To create an RGB or RGBA composite from 3 (or 4) datasets, pass the datasets as tuple:
the datasets must have the same size as the coordinate arrays!
the datasets must be scaled between 0 and 1
If you pass a tuple of 3 or 4 arrays, they will be used to set the RGB (or RGBA) colors of the shapes, e.g.:
m.plot_map(fc=(<R-array>, <G-array>, <B-array>))m.plot_map(fc=(<R-array>, <G-array>, <B-array>, <A-array>))
You can fix individual color channels by passing a list with 1 element, e.g.:
m.plot_map(fc=(<R-array>, [0.12345], <B-array>, <A-array>))
from eomaps import Maps
import numpy as np

x, y = np.meshgrid(np.linspace(-30, 30, 100), np.linspace(-30, 0, 50))

# values must be between 0 and 1
r = np.random.randint(0, 100, x.shape) / 100
g = np.random.randint(0, 100, x.shape) / 100
b = [0.4]
a = np.random.randint(0, 100, x.shape) / 100

m = Maps(figsize=(10, 5))

m.set_data(data=None, x=x, y=y)
m.set_shape.raster()
m.plot_map(fc=(r, g, b, a))
## add gridlines and ticklabels
g = m.add_gridlines(d=10, lw=1, linestyle='--', color='k')
g.add_labels(fontsize=10)

m.show()