Ctrl+K
EOmaps  documentation - Home EOmaps  documentation - Home
  • Installation
  • User guide
  • Examples
  • API Reference
  • Contribution Guide
  • FAQ
  • GitHub
  • PyPI
  • conda-forge
  • Installation
  • User guide
  • Examples
  • API Reference
  • Contribution Guide
  • FAQ
  • GitHub
  • PyPI
  • conda-forge

Section Navigation

  • Basic data visualization
    • Basic data visualization
  • Manage Maps
    • Inset-maps - get a zoomed-in view on selected areas
    • Multiple Maps and Data-classification
  • Images, Contours, WebMap
    • Contour plots and Contour Levels
    • Plot RGB images on a map
    • WebMap services and layer-switching
  • Points, Lines, Polygons
    • Lines and Annotations
    • Vector-data interactive geometries
  • Geographical Map Components
    • Gridlines and Grid Labels
    • Using Scalebars
  • Customize the appearance of plot
    • Customize the appearance of the plot
  • Overlays, markers and annotations
    • Overlays, markers and annotations
  • Callbacks : turn your maps into interactive widgets
    • Callbacks : turn your maps into interactive widgets
  • Widgets for data analysis
    • Select 1D slices of a 2D dataset
    • Timeseries and histograms
  • 🗺 EOmaps examples
  • Widgets for data analysis

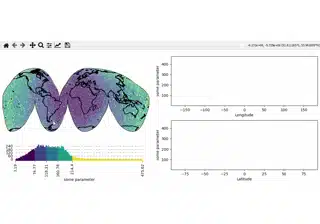
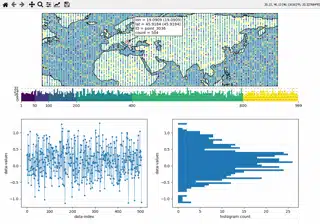
Widgets for data analysis#

Select 1D slices of a 2D dataset
Timeseries and histograms

previous

Callbacks : turn your maps into interactive widgets

next

Select 1D slices of a 2D dataset

This Page

  • Show Source

Created using Sphinx 8.0.2.

Built with the PyData Sphinx Theme 0.16.1.