🏕 Annotations, Markers, Logos, etc.
Annotations
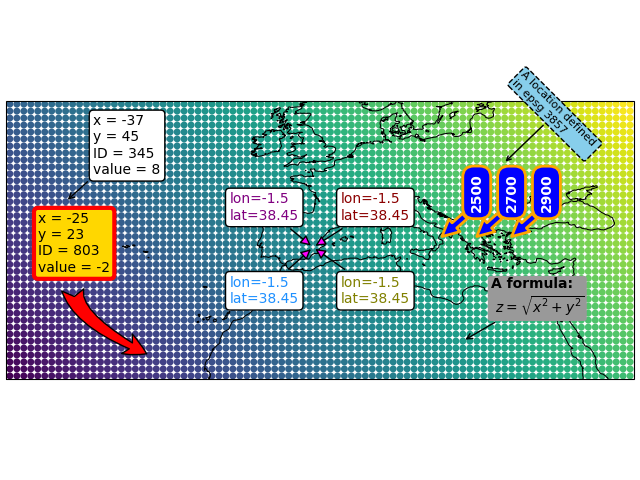
Static annotations can be added to the map via Maps.add_annotation().
If a dataset has been plotted, you can mark any datapoint via its ID, e.g. using
ID=...To add a marker at an arbitrary position, use
xy=(...)By default, the coordinates are assumed to be provided in the plot-crs
You can specify arbitrary coordinates via
xy_crs=...
Additional arguments are passed to matplotlib.pyplot.annotate and matplotlib.pyplot.text
This gives a lot of flexibility to style the annotations!
To dynamically add annotations if you click on the map, checkout the associated pre-defined callback
m.cb.click.attach.annotate() (or m.cb.pick.attach.annotate())
Add an annotation to the plot. |
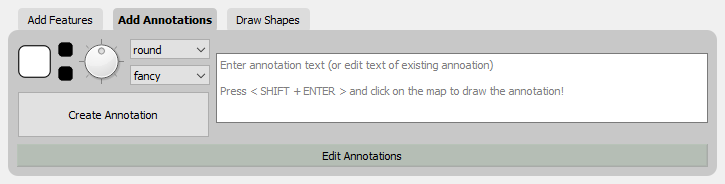
Interactively add annotations and re-position/re-style existing annotations
The Companion Widget provides some capabilities to quickly put annotations on a map via the Add Annotations tab.
Starting with EOmaps v7.0 it is also possible to interactively edit existing annotations by activating the Edit Annotations button.
from eomaps import Maps
import numpy as np
x, y = np.mgrid[-45:45, 20:60]

m = Maps(crs=4326)
m.set_data(x+y, x, y)
m.add_feature.preset.coastline(ec="k", lw=.75)
m.plot_map()

# annotate any point in the dataset via the data-index
m.add_annotation(ID=345)
# annotate an arbitrary position (in the plot-crs)
m.add_annotation(
    xy=(20,25), text="A formula:\n $z=\sqrt{x^2+y^2}$",
    fontweight="bold", bbox=dict(fc=".6", ec="none", pad=0.2))
# annotate coordinates defined in arbitrary crs
m.add_annotation(
    xy=(2873921, 6527868), xy_crs=3857, xytext=(5,5),
    text="A location defined \nin epsg 3857", fontsize=8,
    rotation=-45, bbox=dict(fc="skyblue", ec="k", ls="--", pad=0.2))

# functions can be used for more complex text
def text(m, ID, val, pos, ind):
    return f"lon={pos[0]}\nlat={pos[1]}"

props = dict(xy=(-1.5, 38.45), text=text,
             arrowprops=dict(arrowstyle="-|>", fc="fuchsia",
                             mutation_scale=15))

m.add_annotation(**props, xytext=(20, 20), color="darkred")
m.add_annotation(**props, xytext=(-60, 20), color="purple")
m.add_annotation(**props, xytext=(-60, -40), color="dodgerblue")
m.add_annotation(**props, xytext=(20, -40), color="olive")

# multiple annotations can be added in one go (xy=([...], [...]) also works!)
m.add_annotation(ID=[2500, 2700, 2900], text=lambda ID, **kwargs: str(ID),
                 color="w", fontweight="bold", rotation=90,
                 arrowprops=dict(width=5, fc="b", ec="orange", lw=2),
                 bbox=dict(boxstyle="round, rounding_size=.8, pad=.5",
                           fc="b", ec="orange", lw=2))

m.add_annotation(ID=803, xytext=(-80,60),
                 bbox=dict(ec="r", fc="gold", lw=3),
                 arrowprops=dict(
                     arrowstyle="fancy", relpos=(.48,-.2),
                     mutation_scale=40, fc="r",
                     connectionstyle="angle3, angleA=90, angleB=-25"))
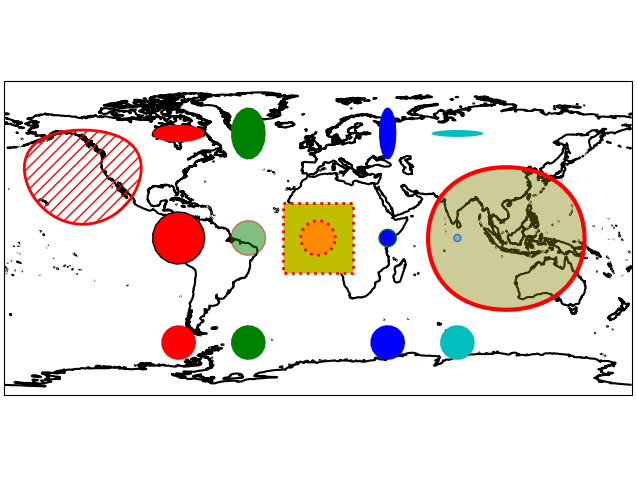
Markers
Static markers can be added to the map via Maps.add_marker().
If a dataset has been plotted, you can mark any datapoint via its ID, e.g.
ID=...To add a marker at an arbitrary position, use
xy=(...)By default, the coordinates are assumed to be provided in the plot-crs
You can specify arbitrary coordinates via
xy_crs=...
The radius is defined via
radius=...By default, the radius is assumed to be provided in the plot-crs
You can specify the radius in an arbitrary crs via
radius_crs=...
The marker-shape is set via
shape=...Possible arguments are
"ellipses","rectangles","geod_circles"
Additional keyword-arguments are passed to the matplotlib collections used to draw the shapes (e.g. “facecolor”, “edgecolor”, “linewidth”, “alpha”, etc.)
Multiple markers can be added in one go by using lists for
xy,radius, etc.
To dynamically add markers if you click on the map, checkout the associated pre-defined callback
m.cb.click.attach.mark() (or m.cb.pick.attach.mark())
Add a marker to the plot. |
from eomaps import Maps
m = Maps(crs=4326)
m.add_feature.preset.coastline()

# ----- SINGLE MARKERS
# by default, MARKER DIMENSIONS are defined in units of the plot-crs!
m.add_marker(xy=(0, 0), radius=20, shape="rectangles",
             fc="y", ec="r", ls=":", lw=2)
m.add_marker(xy=(0, 0), radius=10, shape="ellipses",
             fc="darkorange", ec="r", ls=":", lw=2)

# MARKER DIMENSIONS can be specified in any CRS!
m.add_marker(xy=(12000000, 0), xy_crs=3857,
             radius=5000000, radius_crs=3857,
             fc=(.5, .5, 0, .4), ec="r", lw=3, n=100)

# GEODETIC CIRCLES with radius defined in meters
m.add_marker(xy=(-135, 35), radius=3000000, shape="geod_circles",
             fc="none", ec="r", hatch="///", lw=2, n=100)

# ----- MULTIPLE MARKERS
x = [-80, -40, 40, 80]    # x-coordinates of the markers
fc = ["r", "g", "b", "c"] # the colors of the markers

# N markers with the same radius
m.add_marker(xy=(x, [-60]*4), radius=10, fc=fc)

# N markers with different radius and properties
m.add_marker(xy=(x, [0]*4),  radius=[15, 10, 5, 2],
             fc=fc, ec=["none", "r", "g", "b"], alpha=[1, .5, 1, .5])

# N markers with different widths and heights
radius = ([15, 10, 5, 15], [5, 15, 15, 2])
m.add_marker(xy=(x, [60]*4), radius=radius, fc=fc)
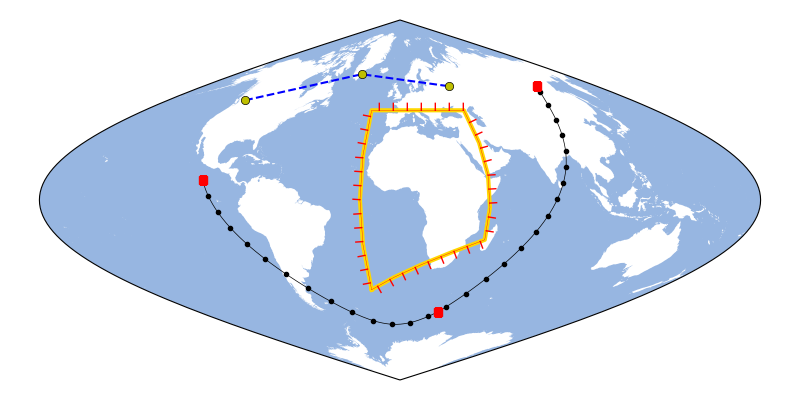
Lines
Lines can be added to a map with Maps.add_line().
A line is defined by a list of anchor-points and a connection-method
The coordinates of the anchor-points can be provided in any crs
Possible connection-methods are:
connect="geod": connect points via geodesic lines (the default)use
n=10to calculate 10 intermediate points between each anchor-pointor use
del_s=1000to calculate intermediate points (approximately) every 1000 meterscheck the return-values of
Maps.add_line()to get the actual distances used in each line-segment
connect="straight": connect points via straight linesconnect="straight_crs": connect points with reprojected lines that are straight in a given projectionuse
n=10to calculate 10 (equally-spaced) intermediate points between each anchor-point
Additional keyword-arguments are passed to matplotlib.pyplot.plot
This gives a lot of flexibility to style the lines!
Draw a line by connecting a set of anchor-points. |
from eomaps import Maps
import matplotlib.patheffects as path_effects

m = Maps(Maps.CRS.Sinusoidal(), figsize=(8, 4))
m.add_feature.preset.ocean()

p0 = [(-100,10), (34, -56), (125, 57)]
p1 = [(-120,50), (-42, 63), (45, 57)]
p2 = [(-20,-45), (-20, 45), (45, 45), (45, -20), (-20,-45)]


m.add_line(p0, connect="geod", del_s=100000,
           lw=0.5, c="k", mark_points="rs",
           marker=".", markevery=10)

m.add_line(p1, connect="straight", c="b", ls="--",
           mark_points=dict(fc="y", ec="k", lw=.5))

m.add_line(p2, connect="straight_crs", c="r",
           n=5, lw=0.25, ms=5,
           path_effects=[
               path_effects.withStroke(linewidth=3,
                                       foreground="gold"),
               path_effects.TickedStroke(angle=90,
                                         linewidth=1,
                                         length=0.5)])
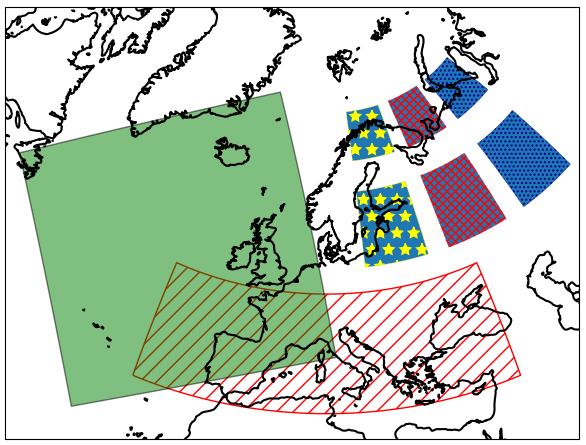
Rectangular areas
To indicate rectangular areas in any given crs, simply use Maps.indicate_extent():
Indicate a rectangular extent in a given crs on the map. |
from eomaps import Maps
m = Maps(crs=3035)
m.add_feature.preset.coastline(ec="k")

# indicate a lon/lat rectangle
m.indicate_extent(-20, 35, 40, 50, hatch="//", fc="none", ec="r")

# indicate some rectangles in epsg:3035
hatches = ["*", "xxxx", "...."]
colors = ["yellow", "r", "darkblue"]
for i, h, c in zip(range(3), hatches, colors):
    pos0 = (2e6 + i*2e6, 7e6, 3.5e6 + i*2e6, 9e6)
    pos1 = (2e6 + i*2e6, 7e6 + 3e6, 3.5e6 + i*2e6, 9e6 + 3e6)

    m.indicate_extent(*pos0, crs=3857, hatch=h, lw=0.25, ec=c)
    m.indicate_extent(*pos1, crs=3857, hatch=h, lw=0.25, ec=c)

# indicate a rectangle in European Equi7Grid  projection
m.indicate_extent(1000000, 1000000, 4800000, 4800000,
                  crs=Maps.CRS.Equi7_EU,
                  fc="g", alpha=0.5, ec="k")
Logos
To add a logo (or basically any image file .png, .jpeg etc.) to the map, you can use Maps.add_logo().
Logos can be re-positioned and re-sized with the 🏗️ Layout Editor!
To fix the relative position of the logo with respect to the map-axis, use
fix_position=True
from eomaps import Maps
m = Maps()
m.add_feature.preset.coastline()
m.add_logo(position="ul", size=.15)
m.add_logo(position="ur", size=.15)
# notice that the bottom logos maintain their relative position on resize/zoom events!
# (and also that they can NOT be moved with the layout-editor)
m.add_logo(position="lr", size=.3, pad=(0.1,0.05), fix_position=True)
m.add_logo(position="ll", size=.4, fix_position=True)
Add a small image (png, jpeg etc.) to the map. |