▦ Gridlines
How to add grid lines to a map
Gridlines can be added to the map via Maps.add_gridlines().
If d is provided, the gridlines will be fixed
If you provide a number, it is used as grid-spcing (in degrees)
If you provide a
listornumpy.array, it is used to draw lines only at the specific coordinatesTo use different settings for latitude and longitude lines, provide a
2-tupleof the aforementioned types.
If no explicit grid-spacing is provided (e.g. d=None), the grid is dynamically updated based on the visible extent.
Use
auto_n=...to adjust the density of the auto-gridlines.
Add gridlines to the map. |
Add gridlines to the map. |
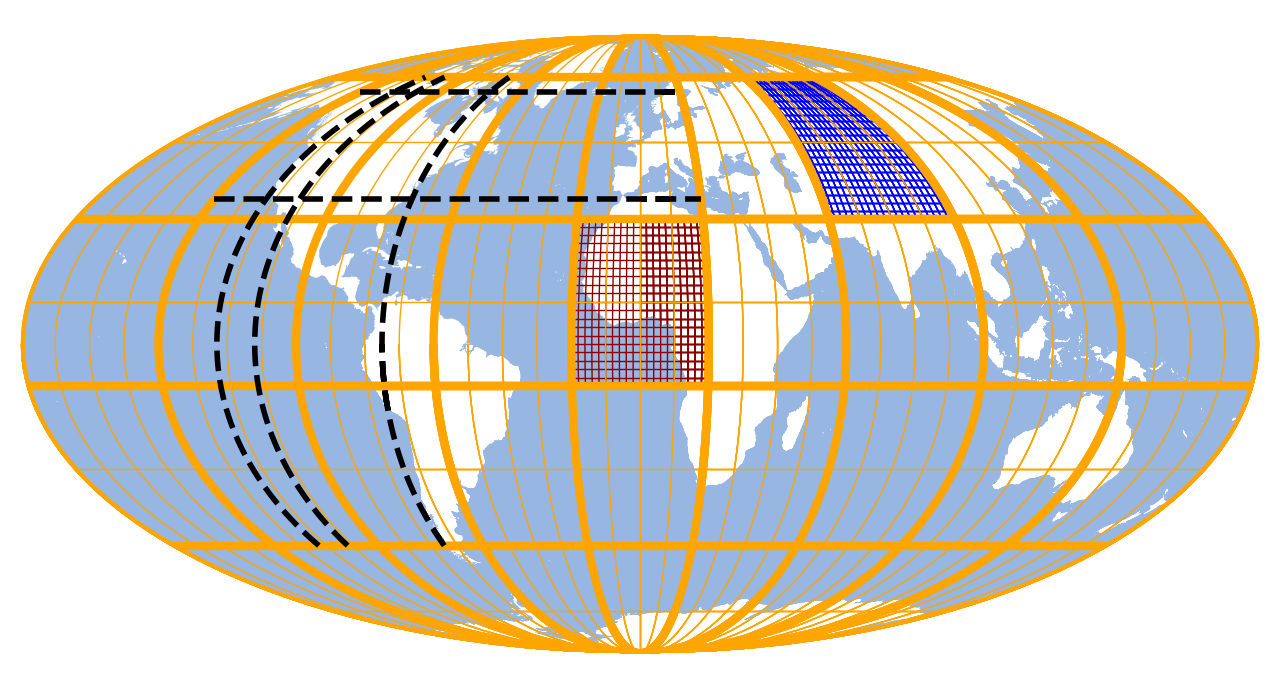
from eomaps import Maps
m = Maps(Maps.CRS.Mollweide(), frameon=False)
m.add_feature.preset.ocean()

# add gridlines with a fixed grid-spacing
mg = m.new_layer("grid")
g0 = mg.add_gridlines(d=40, ec="orange", lw=3, zorder=2)
g1 = mg.add_gridlines(d=(10, 20), ec="orange", lw=.5, zorder=1)

# add fine-grained gridlines in a specific area
g2 = mg.add_gridlines(d=2, ec="darkred", lw=0.5, zorder=0,
                      bounds=(-20, 20, -10, 30))
g3 = mg.add_gridlines(d=2, ec="b", lw=0.5, zorder=0,
                      bounds=(60, 100, 30, 70))

# add dedicated gridlines at specific coordinates
g4 = mg.add_gridlines(([-123, -112, -75], [35, 65]),
                      ec="k", lw=2, ls="--", zorder=20,
                      bounds=(-140, 20, -50, 70)
                      )

m.show_layer(m.layer, "grid")
In addition, the returned GridLines instance supports the following
useful methods:
Base class for EOmaps grid-lines (and associated grid-labels). |
|
Set a fixed gridline distance (in degrees). |
|
Set the number of (auto) gridlines to draw in the currently visible extent. |
|
Set the number of intermediate points to calculate for each gridline. |
|
Set the extent of the area in which gridlines are drawn. |
|
Set/update the properties of the drawn lines (e.g. color, linewidth etc.). |
|
Remove the grid from the map. |
|
Add labels to the gridlines. |
How to add labels to a grid
Labels can be added to a grid via the GridLines.add_labels() directive.
In general, labels are added at points where the lines of the grid intersects with the axis-boundary. (Note that this provides a lot of flexibility since a map can have as many grids as you like and each grid can have its own labels!)
The where parameter can be used to control where grid labels are added:
Use an arbitrary combination of the letters
"tblr"to draw labels at the top, bottom, left or right boundaries.If this option is used, longitude-lines are only labeled top/bottom and latitude-lines are only labeled left/right.
Use
"all"to label all intersection points.Use an integer to draw labels only at the nth found intersection-points.
In addition, the exclude parameter can be used to exclude specific labels based on their lon/lat values and the every parameter can
be used to add a label only to every nth grid line.
To change the appearance of the labels, any kwarg supported by matplotlib.pyplot.text can be used (e.g. color, fontsize, fontweight, …).
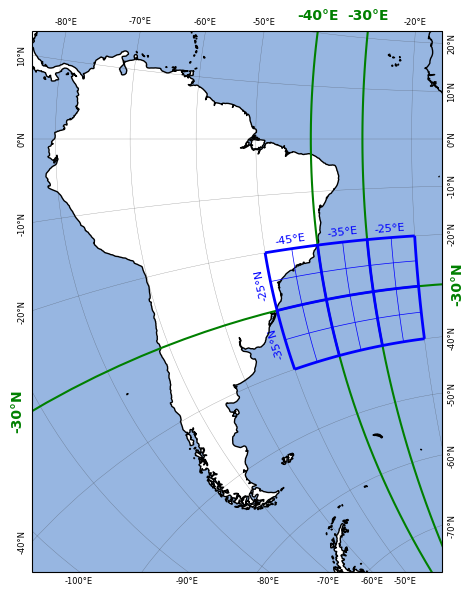
from eomaps import Maps
m = Maps(Maps.CRS.Stereographic(), figsize=(5, 6))
m.set_extent((-83, -20, -59, 13))
m.add_feature.preset.coastline()
m.add_feature.preset.ocean()

# draw a regular grid with 10 degree grid-spacing
# and add labels to all lines except some selected lines
g = m.add_gridlines(10, lw=0.25, alpha=0.5)
g.add_labels(fontsize=6, exclude=([-40, -30], [-30]))

# draw some specific gridlines and add bold green labels
g = m.add_gridlines(([-40, -30], [-30]), c="g", lw=1.5)
gl0 = g.add_labels(where="tlr", c="g", offset=15, fontweight="bold")

# draw a bounded grid and add labels
g = m.add_gridlines(10, bounds=[-50, -20, -40, -20], c="b", lw=2)
g = m.add_gridlines(5,  bounds=[-50, -20, -40, -20], c="b")
gl = g.add_labels(where=0, fontsize=8, every=(1, -1, 2), c="b")