🔬 Inset Maps
How to create inset maps
Inset maps are used to show zoomed-in regions of a map and can be created with Maps.new_inset_map().
Create a new (empty) inset-map that shows a zoomed-in view on a given extent. |
An inset-map is defined by providing a center-position and a radius.
The shape of the inset boundary can be one of the following options:
projected “ellipses” or “rectangles” (with dimensions defined in a given coordinate-system)
“geodesic_circles” (with a radius defined in meters).
Note
InsetMaps can be used just like any other Maps object!
For convenience, InsetMaps have the following additional methods defined:
Set the (center) position and size of the inset-map. |
|
Add a polygon to a map that indicates the current extent of this inset-map. |
|
Add a line that connects the inset-map to the inset location on a given map. |
Tip
To quickly re-position (and re-size) inset-maps, make sure to have a look at the 🏗️ Layout Editor!
A more advanced example on how to use inset-maps is available here: Inset-maps - get a zoomed-in view on selected areas
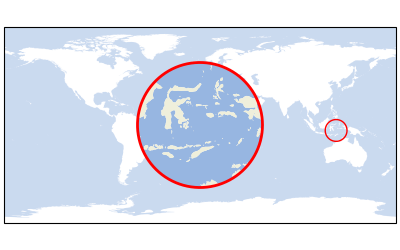
from eomaps import Maps
m = Maps(figsize=(4, 2.5))
m.add_feature.preset.ocean(alpha=0.5)

mi = m.new_inset_map(xy=(125, -5), radius=10)   # create a new inset-map
mi.add_feature.preset("ocean", "land")          # populate the inset-map with some features

m.show()
There are many ways to customize the appearance of an inset-map.
Tip
Inset-maps can have a different projection than the parent map!
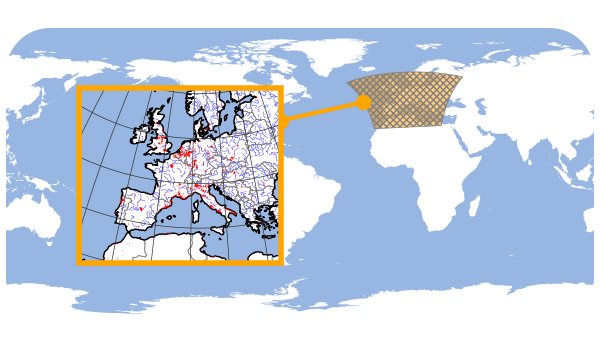
You can also specify the position and radius of an inset-map in a coordinate system of your choice.
from eomaps import Maps
m = Maps(Maps.CRS.PlateCarree(central_longitude=-60), figsize=(6, 3.5))
m.add_feature.preset.ocean()
m.set_frame(ec="none", rounded=0.3)

m_i = m.new_inset_map(xy=(5, 45), xy_crs=4326,
                      radius=2e6, radius_crs=3035,
                      plot_position=(.3, .5), plot_size=.5,
                      shape="rectangles",
                      inset_crs=3035,
                      boundary=dict(ec="orange", lw=4),
                      indicate_extent=dict(fc=(1, 0.6, 0, .5), ec="0.5", lw=0.5, hatch="xxxxx"),
                      indicator_line=dict(lw=3, marker="o", ms=10)
                      )

m_i.add_feature.preset("coastline", "countries", "ocean", "urban_areas")
m_i.add_feature.physical.rivers_europe(ec="b", lw=0.25, fc="none")
m_i.add_feature.physical.lakes_europe(fc="b")
m_i.add_gridlines()
m.show()
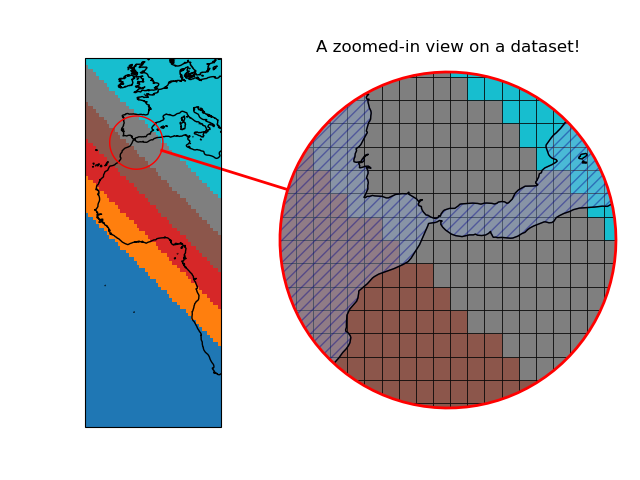
Zoomed in views on datasets
To create a “zoomed-in” view of a dataset, the data must be plotted on the inset-map with the same classification as the initial plot.
For this purpose, EOmaps provides 2 convenience-functions:
Maps.inherit_data: Use the same dataset as anotherMapsobjectMaps.inherit_classification: Use the same classification as anotherMapsobject
Note
If the classification is inherited, also the the used colormap and the associated data-limits vmin and vmax will be the inherited!
Tip
You can still change the shape that is used for plotting to adjust the appearance of the data in the zoomed-in view!
import numpy as np
x, y = np.meshgrid(np.linspace(-20, 20, 50), np.linspace(-50, 60, 100))
data = x + y
Create a map and plot a classified dataset.
from eomaps import Maps
m = Maps(ax=131)
m.add_feature.preset.coastline()
m.set_data(data, x, y)
m.set_shape.raster()
m.set_classify.Quantiles(k=10)
m.plot_map(cmap="tab10", vmin=-10, vmax=40)
Create a new inset-map that shows a zoomed-in view on the dataset.
m_i = m.new_inset_map(xy=(-5, 35), radius=8,
                      plot_position=(0.7, .5), plot_size=.7, indicator_line=True)
m_i.add_title("A zoomed-in view on a dataset!", y=1.05)

m_i.add_feature.preset.coastline()
m_i.add_feature.preset.ocean(alpha=0.4, zorder=10, hatch="///", ec="darkblue")

m_i.inherit_data(m)            # inherit the data from "m"
m_i.inherit_classification(m)  # inherit the classification from "m"
m_i.set_shape.rectangles()     # switch to a different shape for plotting
m_i.plot_map(ec="k", lw=0.5)
m.show()